Thursday 18 December 2008

Domain Specific Languages (VI)

Generating Code from the Model

The DSL will now be tested by producing a model, and developing a T4 template to generate code from the model.
  • In the DSL (running under the Visual Studio Experimental Hive), open Sample.mydsl, and draw a model of a Male class inheriting from a Person class, and a Female class inherting from the same Person class. Set the Visibility property of all classes to public.
  • Open MyDSLSampleReport.tt. In text templates, you indicate directives by using <#@ tags, statements with <# tags, and expressions with <#= tags.
  • Change the output extension directive to .cs.
  • Comment out the generated material line.
  • Change the foreach loop to that shown in the image below. To use code outlining and intellisense, download and install the Clarius T4 Editor. The loop states that for each Class in the ClassModel, display the class Visibility, the word class, the class Name, and then if the class has a BaseClass, to display the BaseClass name after a colon.

  • Save the T4 template and examine the generated code (MyDSLSample.cs). The generated code lists the class visibility, the class name, and the base class (if applicable).
Conclusion

In this series of posts I've shown you how to create and customize a simple Domain Specific Language by using the DSL Tools that are part of the Visual Studio SDK. There’s a lot more to DSLs than covered here, including more extensive customization, adding and using coherence rules, performing model validation both interactively and on request, writing more extensive T4 templates, and deploying a DSL by obtaining and adding the necessary package load keys, and creating a DSL setup project. For more information on these topics, see the VSX website.

Domain Specific Languages (V)

Customizing the Graphical Notation

The DSL graphical notation will now be customized:
  • Rename ExampleShape to ClassShape.
  • Change the Fill Color property of ClassShape to a suitable colour.
  • Change the Geometry property of ClassShape to rounded rectangle (the standard for UML class diagrams).
  • Add a text decorator to ClassShape called Visibility. This is necessary so that the user can enter a visibility level (public, private etc.). To do this, right-click on ClassShape and select Add->Text Decorator.
  • Map the Visibility text decorator to the Visibility property of Class in the DSL Details window. To do this, click the DSL Details window, and select the line that links ClassShape to Class. In the DSL Details window, select the Decorator Maps tab, select the Visibility check box, and then set the Display Property combo box to Visibility. This ensures that when the user enters a class visibility, that it will be stored in the Visibility property of Class. Close the DSL Details window.

  • Rename NameDecorator to Name.
  • Rename ExampleConnector to ClassConnector.
  • Change the Target End Style property of ClassConnector to Hollow Arrow (the standard for UML class diagrams).

After making these changes, your domain model should look like:

Customizing the DSL Toolbox

  • In DslExplorer, expand Editor/Toolbox Tabs/MyDslSample/Tools.
  • Change the Name property of ExampleElement to Class.
  • Change the ToolTip property of ExampleElement to “Creates a Class”.
  • Change the Name property of ExampleRelationship to Inheritance.
  • Change the ToolTip property of ExampleRelationship to “Drag between Classes to create an Inheritance relationship”.

Click the Transform All Templates button. Once the template transformation process has finished, build the application and run it without debugging. The DSL will launch in the Visual Studio Experimental Hive.

Domain Specific Languages (IV)

Customizing the Domain Model

In order to produce a DSL for modelling simple inheritance relationships, the minimal language domain model produced by the wizard will have to be customized. This will involve renaming the name of the domain classes and domain relationships, adding a new domain property to store the class visibility (public/private etc.), and adding a textual decorator to display the visibility property:
  • Rename ExampleModel to ClassModel.
  • Rename the ExampleElement domain class to Class.
  • Rename the Elements role to Classes.
  • Rename the ClassReferencesTargets relationship to Inheritance.
  • Rename the Targets role to BaseClass.
  • Change the Multiplicity property of BaseClass to 0..1.
  • Rename the Sources role to DerivedClasses.
  • Add a domain property to Class, named Visibility of type String (will enable the user to specify the visibility of the class). To do this, right-click on Class and select Add->DomainProperty.
After making these changes, your domain model should look like:

Finally, click the Transform All Templates button.


Template transformation should always be performed when anything changes in the model, so that the generated code reflects the domain classes and domain relationships on the diagram.

Domain Specific Languages (III)

Understanding the Domain Specific Language

The generated graphical DSL includes the following features:
  • Domain Model: a DSL is defined by its domain model. The domain model includes the domain classes and domain relationships that form the basis of the DSL. The domain model is not the same as a model. The domain model is the design-time representation of the DSL, while the model is the run-time instantiation of the DSL. Domain classes are used to create the various elements in the domain, and domain relationships are the links between the elements. The domain model can be seen in the Classes and Relationships swimlane of the image below.

    Every domain relationship has two roles: a source role and a target role. The Name property of a role is the name that is used to navigate from a domain relationship to one of the domain classes that it connects. The PropertyName property of a role is used to navigate from an element at one end of the relationship to the element or elements at the opposite end of the relationship. The DisplayName property of a role is used in the DSL Explorer to show relationships between elements. By default, the value of the DisplayName property is the same as that of the Name property.

    Multiplicities specify how many elements can have the same role in a domain relationship. In most cases, the number of relationships that are connected to a given element is the same as the number of elements that are connected through those relationships. In the diagram, the zero-to-many (0..*) multiplicity setting on the Elements role specifies that any instance of the ExampleModel domain class can have as many ExampleModelHasElements relationship links as you want to give it. A multiplicity of one (1..1) on a role specifies that each instance of the domain class can have only one link in the relationship.


  • Graphical Notation: a DSL has a set of elements that can be easily defined and extended to represent domain-specific constructs. A graphical notation consists of shapes, which represent the elements, and connectors, which represent the relationships between elements, on a graphical diagram surface. The graphical notation can be seen in the Diagram Elements swimlane in the image above.
  • Artifact Generators: one of the main purposes of a DSL is to generate an artefact, for example, source code. A change in the model typically results in a change in the artifact. Here, artifacts are generated from T4 files (file extension .tt). In the Dsl project, look at the T4 files in the GeneratedCode folder, and the corresponding C# files they generate.

  • Serialization: a DSL must be persisted in a format that can be edited, saved and reloaded. DSL Tools use an XML format.

Domain Specific Languages (II)

Creating a Domain Specific Language

If you've installed the Visual Studio 2008 SDK, there will be some new project templates available for you to use when you choose New Project in Visual Studio. Select the Domain-Specific Language Designer project type, which can be found underneath Other Project Types and Extensibility. Choose a name for your project (MyDslSample), make sure it will be saved in a suitable location and then click OK. The Domain-Specific Language Designer wizard will appear and guide you through the process of creating a DSL solution.

The first step is to choose one of the solution templates. By choosing the template that most closely resembles the language that you want to create, you can minimize the modifications that you have to make to the starting solution. The solution templates that are available are:
  • Class Diagrams: use this template if your DSL includes entities and relationships that have properties. This template creates a DSL that resembles UML class diagrams.
  • Component Models: use this template if your DSL includes components, that is, parts of a software system. This template creates a DSL that resembles UML component diagrams.
  • Task Flow: use this template if your DSL includes workflows, states, or sequences. This template creates a DSL that resembles UML activity diagrams.
  • Minimal Language: use this template if your DSL does not resemble the other templates. This template creates a DSL that has two classes and one relationship.

Create a minimal language DSL and give it a name (MyDslSample). The wizard will register a new file type for models in your language. Therefore you should choose a file extension that is unique to your system. Accept the default icon for the model files, as it can be changed later if necessary. Accept the default values for the product name, company name, and top level namespace that will be used in the solution. Sign your assembly with a strong key name, review your choices and then click Finish. Visual Studio will create a solution consisting of two projects:

  • Dsl, defines the DSL and its editing and processing tools.
  • DslPackage, determines how the language tools integrate with Visual Studio.

After the solution is created, a large amount of code is generated automatically from the DSL description file (DslDefinition.dsl) by applying a custom tool called TextTemplatingGenerator to the files in T4 format.

Domain Specific Languages (I)

Domain Specific Languages are a relatively unknown piece of Visual Studio Extension technology. In this series of posts, I'm going to describe how to create a Domain Specific Language for modelling simple inheritance, and generating code from the model. The purpose is to do it from scratch, see the process, and understand the concepts involved. You’ll require Visual Studio 2008 Service Pack 1, and the Visual Studio SDK 1.1 to do this on your own machine.

Unlike a general purpose language such as C#, a domain-specific language is designed to handle a particular problem space, or domain. Domains can be defined in many different ways. Some domains are associated with specific industries or kinds of business (insurance domain, financial services domain, library domain). Other domains relate to specific kinds of software development (Web service components, GUI components etc.).

Typically, DSLs are created when a development team has to write similar code for different projects. For example, a team may have to develop several different insurance policy applications. The applications may use the same constructs, for example, a table that specifies the policy prices in different areas, in different ways. In a DSL, the price/area table can be a language element that is handled differently in each application.

DSLs can either be textual or graphical. An example of a textual DSL is an XML schema. Textual DSLs are difficult to develop and debug, and non-technical people may find them hard to understand. Graphical DSLs are easier to work on and easier to use for communicating with non-developers.

Domain-specific development is the process of identifying the parts of your applications that can be modelled by using a DSL, and then constructing the language and deploying it to application developers. The developers use the DSL to construct models that are specific to their applications, use the models to generate source code, and then use the source code to develop the applications.

The benefits of DSL development include:
  • DSL consists of elements and relationships that directly represent the logic of the problem space. Therefore, its easier to design the application, and find and correct errors of logic.
  • They let non-developers and people who do not know the domain understand the overall design.
  • Developers can use the code that their model generates to quickly create a prototype application that they can show to clients.
DSL Tools let you create a DSL that has your own graphical designer and your own diagram notation, and then use the language to generate appropriate source code for each project.

Wednesday 17 December 2008

The CM Christmas Card - Powered by Deep Zoom!

Take a look for yourself by clicking the following link!

http://www.contentmaster.com/holiday-08/

Note that you will need the Silverlight plug-in installed to view the card. If you do not have it (or are unsure if you have it or not) the link will guide you the official Silverlight website where you can download it.

Deep Zoom was introduced to the world by Vertigo at the Mix 08 conference with their amazing Hard Rock Café Memorabilia application. It is an implementation of the Microsoft SeaDragon project that is more commonly used in Silverlight applications but is now appearing in other technologies such as Ajax.

As you can see from the Christmas card, DeepZoom gives the impression that the user is able to pan and zoom a very large image in a very smooth and seamless manner with very little lag and loading time. This is made possible by Deep Zoom’s XML based file format and a large “collection” of separate images that are arranged in a pyramid. These are then loaded as on the fly depending on where the user is located within the collection.

To help you on your journey across the sea of pixels, we have wrapped the Deep Zoom control (Silverlight’s MultiScaleImage control) with a navigation menu to give you easy access to a pan control, a Zoom slider and a “Home” button in case you loose your way.

Also check out the CM and Luminosity websites by clicking the relevant logos

Happy Holidays!

Visual Studio Project System

Following on from the previous post on Visual Studio extensibility (VSX), I'd like to point out an extremely useful resource for anyone looking at extending Visual Studio's project system. The IronPython project is hosted on CodePlex with all of it's source code for you to look at. From the perspective of Visual Studio, this shows you how to create a complete project system! So you can see implementations of new project and item templates with parameter substitution along with wizards. It also includes things like intellisense and a custom build environment for the IronPython language. A lot of this is achieved using another Codeplex project - the Managed Package Framework for Projects (MPFProj) - which gives you a framework for building a custom project environment in Visual Studio. At the moment MPFProj is not included as part of the Visual Studio SDK, and you need to include all the MPFProj source in your own project - but keep an eye on this project here (VSXtra) for a DLL containing a pre-compiled version of the MPFProj code.

Extending Visual Studio

I've recently had the opportunity to investigate some of the extensibility features in Visual Studio 2008, and not surprisingly there are a lot of different methods open to you. By extensibility I mean extending the functionality of Visual Studio over and above what's in the box in some way, not just customising the IDE to suit your way of working. Here are the main ways you can set about extending Visual Studio, starting with the simplest and moving to the most advanced.

Templates enable you to define your own variations on standard project types or items. So if you find yourself repeatedly recreating the same basic project over and over again, a new project template can save you a lot of effort. Simply create the basic project you'd like to reuse, and then use the "Export Template Wizard" from the File menu in Visual Studio. Then you'll have a new project type available whenever you create a new project in Visual Studio. You can do the same kind of thing with individual items, so for example you could have a new form type, already populated with some controls and code.

Macros are the next step up, and they work in a very similar way to macros in Office applications. Visual Studio has a macro recorder, so you can record a sequence of operations in the IDE for later play back. These macros are recorded as Visual Basic code, and Visual Studio has a built macro editing environment for tweaking the recorded code. Macros also work as a great learning tool, so if you want to learn how to automate something in Visual Studio you can record a macro and then analyse the code to see how it's done. For an overview of the range of functionality available check out this diagram of the Visual Studio Automation Object Model.

Add-ins come next and offer a couple of features over and above macros. For a start they can be distributed as compiled code and they can be written in any language that supports COM automation. Most importantly they provide a greater degree of integration with Visual Studio, allowing you to add commands to Visual Studio menus and toolbars, add new pages to Visual Studio's Options dialog, and create new tool windows in Visual Studio.

Top of the range though are Visual Studio Packages. To create a package you'll need to download and install the latest version of the Visual Studio SDK and accompanying documentation. The Visual Studio SDK and the package system enables you to do pretty much anything with Visual Studio. All of Visual Studio's existing functionality is written in the form of packages, so you can implement new editors, tool windows, project systems and even re-purpose the basic shell. The VSX website has loads of material on extending the Visual Studio IDE, and a catalogue of available extensions (some free, some commercial).

Friday 12 December 2008

Libraries and Homegroup in Windows 7

Libraries

The Windows 7 team have introduced a new feature in Windows Explorer called Libraries. Libraries are a collection of indexed folders, such as Documents, Downloads, Music, Pictures, and Video libraries. In these libraries, you can group files that are stored anywhere on your computer or even externally, and view them all in one experience without physically copying or moving any files.

Let's take a look at the Documents library and see what features are new. In the Documents library folder, there is a new Documents library pane at the top of the window where you can rearrange the folder structure.


If you were looking for documents created by a particular author, you can choose to arrange your folder structure by Author, and hey presto, the Documents library window stacks all your files by author.

This is great, but what else can it do? And how can this help me? Well for me, saving documents to the desktop is an easy way to open and grab files when I need to, I’m unorganised I know! In Windows 7 tidying up messy documents is easy; you can simply drag them from your desktop for example, and drop them into the Documents library window, and when in the Arrange by Author category, Windows Explorer creates the new author stacks.

You do need to make sure that you remember to add relevant document details such as the author etc in order for the, arrange by filters to be most useful.


You can switch back to the Arrange by Folder view, which is a classic view, to look at a list of your folders, or choose from other views that are most appropriate to your needs.

You can manage folders in your library by clicking the Library Locations button. I want to view a collection of all my music in the Music library, so the first step would be to click Library Locations in my Music library window.

In the Music library window you can add folders from your computer or from an external drive to your Music library. You can also decide which folder will be the default save folder for the library. The default save folder in a library is the location where if you save a document to a specific library, by default, it will be saved in the default save folder.

For those of you that store music on a secondary partition, or an external drive, or both, can now have access to all your music in one place without copying everything into the one folder. Simply click Add, and then navigate to the required folder / drive that your music is stored on. Now in your Music library folder, you will see a collection of all your gathered music. You can do everything with your music that you could do before, click play, click next / previous, and listen to songs.

Unfortunately if you disconnect your external drive from your PC, you will be unable to continue listening to music in your Music library, this is a little annoying, but if your music is stored on your computer somewhere or on another partition, as long as you have established the location, you can still listen to your music in the Music library.

The same principle applies to all your libraries including any new libraries that you want to create, you can gather documents or videos etc from anywhere on your computer by adding folder locations to your desired library.


Homegroup

A homegroup is a new feature in windows 7 that is a way of setting up several computers on a home network, and sharing files with other homegroup members. Only members in your homegroup can view files on your computer, and gaining access to the homegroup network requires a secure password.

Setting up a homegroup in Windows 7 does not require any of the hassle and technical knowledge that is required to set up sharing in Vista. Once you have configured homegroup, you can view homegroup members in Windows Explorer, and here you can drag and drop files into the folders of members who are connected to your homegroup. This is a fantastic way to share files, and it’s easy. You don’t even need to worry about permissions, as Windows 7 have developed the Windows Explorer so that you have private and public libraries.


Before you go ahead and set up a homegroup network, your home computers network location should be set to Home network. Follow these simple steps to set your Windows 7 home computer network location to Home network: -


Setting the Network Location

  1. Click the Start menu.

  2. Click Control Panel.

  3. Click Network and Internet.

  4. Click Networking and Sharing Centre.

  5. In the View your active networks section, underneath your network name, click on the network location link.

  6. In the Set Network Location dialog box, click Home network.


Your network location is now a Home network, and you can set up a homegroup network.

Setting up a homegroup network is also simple, you can set up a homegroup network on a Windows 7 computer at home, by following these simple steps: -

Creating a Homegroup Network
  1. Click the Start menu.

  2. Click Control Panel.

  3. Click Network and Internet.

  4. Click Networking and Sharing Centre.

  5. In the Change your network settings section, click Set up sharing with homegroup.

  6. In the Do you want to create a homegroup? window, click Create now.


  7. In the Create a HomeGroup window, select the library check boxes that you want to share out, and then click Create now.


  8. In the Use this password to add other computers to your homegroup window, jot down the password, and then click Finish.


You have now successfully created a homegroup network!

Finally, you now need to set up other home computers so that the network locations are set to Home network. By doing so, this will enable you to be able to join the homegroup network that you just created. Follow the Setting the Network Location steps above to set your other home computer network location to Home network.

Joining a Homegroup Network

  1. Click the Start menu.

  2. Click Control Panel.

  3. Click Network and Internet.

  4. Click Networking and Sharing Centre.

  5. In the Change your network settings section, click Set up sharing with homegroup.

  6. In the Do you want to join a homegroup? window, click Join now.


  7. In the Computer name has created a homegroup that you can join window, select the library check boxes that you want to share, and then click Join now.


  8. In the Type your homegroup password window, type the homegroup network password, and then click Join now.


  9. In the You have joined the homegroup window, click Finish.


You have now successfully created and joined a homegroup!

To get sharing, open Windows Explorer, and in the navigation pane, click Homegroup. You can now click on the user in your homegroup, open / edit / delete documents (if these permissions are enabled) and even drag and drop documents into homegroup user's folders.


Homegroup is a great way to share you files, and also be more in control. You may notice that the folder structure in Windows 7 differs from that of previous windows OS's, and this is all to do with homegroups.

In Windows Explorer, you have private and public folders for all your libraries. Both folders have different permissions set so that you can manage them in the correct manner. You can also customise them so that the permission settings are exactly what you want. This means that you can make sure your personal folders are kept personal, and you public folders are kept public.

I think that libraries and homegroup are great additions to the new Windows OS, they make the experience much more user friendly and now anyone can use libraries and set up a homegroup and get sharing straight away.


I will be taking a look at Internet Explorer 8 next and I will be posting some more blogs and keeping you updated on what's new :)

Friday 28 November 2008

Searching for files in Windows 7

Searching in Windows 7


I’ve recently been playing with the pre-release build of Windows 7 that Microsoft announced at the Professional Developers Conference (PDC) in LA last month, and I was very impressed with the new searching features. The Windows 7 team have extended the searching features available in Vista, enabling users to gain more refined results, and quicker.

Vista provides great functionality that enables users to search for documents, however the majority of users don’t know this functionality exists, or how to use it. In Vista, when searching for a document, you can filter your search results by querying the files metadata. To do this in Vista you would specify the property you want to query and the value you are looking for. For example, if you wanted to search for documents that were modified on the 12/05/2008 you would query the Data Modified property, so in the search box you would type Date Modified; 12/05/2008. The search results would then display documents modified on this particular day.

The Windows 7 team have enhanced the existing searching functionality found in Vista by improving the user interface. Users no longer need to remember the property names that they wish to query, but can now use the predefined search filters that Windows 7 provides. You can now simply click on the desired search filter, and then type your search requirement.


As you click on the filters and start to type your search item, the search box displays a list of suggestions that are associated with your search. For example, if you wanted to search for the document Travel, in the search box, you would click on the Name search filter, and then start to type Travel. As you begin to type the letter t in the search box, you will be presented with all documents that contain the letter t, you will also notice that the letter t is highlighted in all documents for clarification. As you continue to type your search term, more relevant search results become apparent.


If you want to refine your search further, you can use multiple search filters. You can also preview the document on the right half of the window by clicking on the Preview Pane button on the top right of the window.


With these new user interface changes, you can now easily search, and locate documents you are looking for.

In order for the searching features to be more accurate, you do need to make sure you have added any appropriate tags to the document, and ensure that the document properties are correct. This could be a bit of pain, but if you want to be more organised, this is the way forward!
The Windows 7 team have also introduced a new feature called federated search, now this is really useful! Federated search is a way of searching multiple web resources and online databases and is a feature of web-based library and information retrieval systems.

I downloaded the WSS Demo Site search connector http://www.wssdemo.com/Downloads/wssdemo.osdx created by Ian Morrish, that was used at PDC. I had a little play around with it and I thought it was really good.

Let’s look at an example of using federated search in a possible scenario. Imagine your organisation uses SharePoint to manage company documents; with federated search you can navigate to these documents via a search connector in the navigation pane in Windows Explorer. Windows Explorer sends your search query to the SharePoint site, which then returns the search results back to Windows Explorer for you to view.


You can view these documents and do all the same things you can do with your local documents, for example, you can still preview a document by clicking on the Preview Pane button, right-click and edit a document, or even drag the document to your desktop. It really is as simple as that.

You can even use this SharePoint search connector to search for particular images on the SharePoint site. You could take advantage of this feature using an application such as PowerPoint for example. If you wanted to insert a picture in PowerPoint 2007, you can click on the Insert tab, and then click Picture. In the Insert Picture dialog box, in the navigation pane, you can click on the search connector, and in the search box, type the name of the picture you are looking for. A list of images that match your search requirement are displayed in the window, you can now preview these images and add them into your PowerPoint slide if you wish. With this great functionality, think how much time you can save (and the amount of fun you can have)!


I will be looking at other new features in Windows 7 and keep you updated.

Tuesday 25 November 2008

Software-plus-services equals?

Microsoft has really gone for the cloud (http://www.microsoft.com/azure/windowsazure.mspx), but are its ideas for online services really down to earth?


There have been various online services from Microsoft for a while now, including a range of offerings under the "Live" umbrella. In this post, I want to look at the importance of Microsoft's distinction between Software plus Services and Software as a Service as a description for services such as Microsoft Exchange Online and Microsoft SharePoint Online.

Firstly, Exchange and SharePoint online services are supplied as part of the Microsoft Online Services brand (http://www.microsoft.com/online/default.mspx), and there are several ways to obtain these services; the Business Productivity Online Suite (BPOS), for example, includes Microsoft Exchange Online, Microsoft SharePoint Online, and Microsoft Office Live Meeting. Secondly, Microsoft Online Services uses a subscription model, and you pay monthly for per-user access to any of the online services; the Microsoft Online Services licensing model lets you assign licenses to just those users who really need online access to secure Exchange, SharePoint, and other services.

So, are Microsoft Online Services an example of Software as a Service (SaaS)? Well no, at least not in the sense that SaaS is usually used, which is to define software delivered over the Internet and which eliminates the need for local application installation and maintenance. However, Microsoft Online Services does share a cost model with SaaS, in that you are in effect paying monthly rental on your services. The reason Microsoft describes Microsoft Online Services such as Microsoft Exchange Online and Microsoft SharePoint Online as Software-plus-Services, is that this is a hybrid model – some real local software and some "out there" services.

Moreover, Microsoft Online Services is a hybrid in more ways than one. Perhaps most importantly, you get the hybrid benefits of always-available hosted services out there in the "cloud" combined with the functionality of local client software – the full Microsoft Office experience on your desktop for interacting with local or online Exchange and SharePoint servers. Compare this to the Google applications model, where everything is through the browser – or at least until Google Gears-powered offline access is extended to all types of documents. But Microsoft Online Services is also a hybrid in another way; you can choose just how much of your local services you actually migrate to the online environment. For example, although you might be using Exchange online, this doesn't stop you using local Exchange servers as well and you can choose which of your user's mailboxes get to be accessible through Exchange online. Your hybrid environment also gets to share resources, so that your Exchange Global Address List (GAL), for example, is available to online and local clients.

The hybrid Software-plus-Services model certainly has the potential to deliver the best of both rich local client software and online services, and although this model doesn't completely eliminate local software support requirements (unlike SaaS), it does offer the potential to significantly reduce infrastructure overheads.

And it is the infrastructure issues that are really at the heart of the Software-plus-Services model; if I've still local software to support, the big question is why bother? Surely it is easy enough to set up Outlook Web Access (OWA) for your own Exchange servers, or to publish a SharePoint site which is accessible outside your perimeter network? Well easy if you've got the resources and the experience, but for many smaller organizations dealing with the security implications can make it difficult to justify. If the pricing suits your organization, using a hosted service could make a lot of sense.


OneCare – Don’t Care

On November 18th Microsoft announced that the Windows OneCare product is being killed off (http://www.microsoft.com/Presspass/press/2008/nov08/11-18NoCostSecurityPR.mspx ). Instead of OneCare they are going to make available a free Windows client protection product code-named “Morro” which has been designed to provide a similar level of protection while managing to reduce the impact of this protection on the computer (1).
This change won’t be happening until June 2009 and support for OneCare is likely to continue until June 2010 but it has raised a lot of questions about how seriously Microsoft is taking consumer malware protection. I believe part of this confusion it driven by a misunderstanding in what is required now in the world of malware protection and I honestly believe that Microsoft has got it right here, let me explain how.
Without a doubt the face of malware protection has changed massively it is no longer a part-time hobby for bored students it is now a multi-million dollar industry funded by criminals making money from spam and stolen identities. The malware protection industry is dealing with masses of new malware daily (SophosLabs claims to receive 20,000 suspect samples everyday*) some of these are sophisticated new attacks but most of them are simply reworked examples of previous attacks which are simply dealt with once a signature has been developed. However this message does not help the malware protection vendors sell their product so in an attempt to make their products look better than the rest (and justify the ongoing costs of their products and subscriptions) we have seen the products bloat with extra features and elaborate user interfaces that look impressive but change little of the underlying security of the product.
Microsoft bought into this approach as well by adding features like “OneCare Circle” where home users can manage up to 3 home computers from one place and easily share printers between them. The trouble with these enhancements is that they increase the size and complexity of the product and for the most part they are an inconvenience to the average end user. No one wants to sit and watch a security scan slow their computer down while they are trying to get work done (even if it does look pretty) and the ongoing messages and reports that these product present are just irritating to most of us. We all want, and should get, a safe and secure computer that allows us to get on with the tasks we want or need to do on them with the minimum time and fuss.

Back to Basics with Morro
So how will Morro change things? Well Microsoft is going back to basics and ripping out all the unnecessary clutter and getting back to what matters; the scanning engine, or "Protection Engine" as Microsoft now calls it, and the signature updates.
The protection engine promised in Morro is based on the same engine used in OneCare, Forefront Client Protection, and the Windows Malicious Software Removal Tool (MSRT, the one that comes free already via Windows Update). This engine has a long pedigree as it was originally developed by a company called GeCad that Microsoft purchased back in 2003#, it has been updated by Microsoft as they have modified it to meet their own rigorous Security Development Lifecycle (SDL) coding process but it is still built on the same concepts. You will hear many discussions about just how good this protection will be and yes, there is an argument that other products like Kaspersky or Nod32 can provide better protection but this is like auguring that a BMW is better than a Ford when most of the world doesn’t even own a car and let's be honest would you turn down the option of a Ford if it was free? ;-)
By going back to basics and making Morro free Microsoft has taken a huge step forward in making it harder for malware to spread. Over time I am sure this protection will simply be rolled into the operating system (law suits allowing that is!) as this is where this protection belongs now. No serious operating system can function in today’s online world without at least this level of protection. The industry that has formed around Windows client malware protection will have to evolve or it will follow OneCare into history. With Morro, Forefront codename "Stirling", and Windows 7, 2009 is going to be an interesting year for Windows Security to say the least!

(1) Microsoft have also stated Morro is "a PC security solution tailored to the demands of emerging markets" but for this read "markets that want free client computer protection" I don't see why Microsoft would try to limit Morro to emerging markets if they are also getting rid of OneCare.
* Quote from Sophos Security threat report 07/2008
# http://www.microsoft.com/presspass/press/2003/Jun03/06-10GeCadPR.mspx

Monday 24 November 2008

Adventures in Spatial Data - Part 2

In my previous entry, I described how I created a SQL Server 2008 database that contains spatial data for the BeanieTracker Web application. In this article, I'll examine the Web application itself and discuss how to combine spatial data from SQL Server with the Microsoft Virtual Earth map control. The code for this article is available here.

The aim of the Beanie Tracker application is to use Virtual Earth map control to visualize the spatial data in the database in two ways:
  • Use push-pins to show the locations that Beanie has visited, and include a photograph and the distance from home in the tooltip displayed for each push-pin.
  • Overlay countries Beanie has visited with a colored shape - the more often Beanie has visited the country, the darker the color of the shape.

The first step is to display the Virtual Earth map control in the Web page. The map control is freely available, and provides a Javascript-based API that you can use from pretty much any Web application to add mapping capabilities to your Web site. To include the control in your Web page, you need to do four things:

In the body of the Web page, create a <div> element where you want the map to be displayed:

<div id='mapDiv' style="position:relative; width:600px; height:600px;"/>

In the head of the page, add a reference to the Virtual Earth map control script library:

<script type="text/javascript" src="http://dev.virtualearth.net/mapcontrol/mapcontrol.ashx?v=6">

</script>

In the head of the page, add a script to display the map in the <div> area you created in step 1:

<script type="text/javascript">

var map = null;

// Display the map control

function GetMap()

{

map = new VEMap('mapDiv');

map.LoadMap();

map.SetCenterAndZoom(new VELatLong(0, 0), 1);

}

</script>

In the <body> tag, assign your script to the onload event:

<body onload="GetMap();">

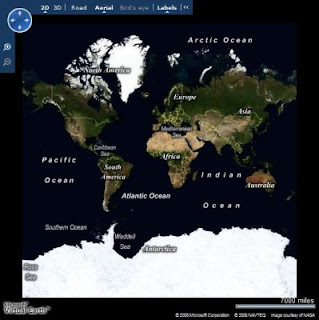
Using only this code, you can include a fully-functional Virtual Earth map control in your Web page. The control provides the ability for users to click and drag to move around the map, zoom by double-clicking or using a mouse scroll wheel, and change the view from a basic map, to arial view (based on satellite imagary) or even to birds-eye view (low level arial photography) where available. The map control is shown here:

On its own, the map control provides some interesting functionality, but for the Beanie Tracker application I want to use the control's API to visualize the data from the database. The key challenge here is to get the data from the database (which is on the server) to the Javascript used to render it on the map (which is in the browser). There are a number of ways to do this, including creating a Web Service or implementing a .aspx page that returns a text/xml document instead of HTML; but one of the most common is to implement a custom HTTP handler that returns the data as a GeoRSS feed, and consume that feed from the Javascript in the Web page. GeoRSS is an XML-based feed format for exchanging Geographic Markup Language (GML) elements across the Internet. Here's an example of a GeoRSS feed:

<?xml version="1.0" encoding="utf-8" ?>

<feed xmlns="http://www.w3.org/2005/Atom"
xmlns:georss="http://www.georss.org/georss"
xmlns:gml="http://www.opengis.net/gml">

<title>BeanieTracker</title>

<subtitle>Beanie Locations</subtitle>

<link href=http://www.graemesplace.com/beanietracker.htm/ />

<updated>10/11/2008 09:28:09</updated>

<author>

<name>Graeme Malcolm</name>

</author>

<entry>

<title>Beanie diving in the Red Sea</title>

<description><img src='Photo.aspx?PhotoID=1' height='100'/><p>4329.09 km from
home</p></description>

<georss:where>

<gml:Point xmlns="http://www.opengis.net/gml">

<gml:pos>27.8487 34.2865</gml:pos>

</gml:Point>

</georss:where>

</entry>

<entry>

<title>Beanie at Edinburgh Castle</title>

<description><img src='Photo.aspx?PhotoID=2' height='100'/><p>18.05 km from
home</p></description>

<georss:where>

<gml:Point xmlns="http://www.opengis.net/gml">

<gml:pos>55.9486 -3.2005</gml:pos>

</gml:Point>

</georss:where>

</entry>

</feed>

To get this feed to the browser, I created an HTTP handler that builds the XML for the feed, inserting the GML representations of the spatial data in the database; which are retrieved through some stored procedures in the database itself. Since there are two options that the user can use to retrieve a GeoRSS feed (one for photos of locations Beanie has visited, and one for a list of countries and a count of visits Beanie has made to them), I added some logic in the HTTP handler to look for a parameter, and create the appropriate feed with data from the corresponding stored procedure. The main sections of code (in VB .NET) from the handler are shown here:

Public Sub ProcessRequest(ByVal context As HttpContext) Implements
IHttpHandler.ProcessRequest

context.Response.ContentType = "text/xml"

Dim rssOutput As New System.Text.StringBuilder("<?xml version='1.0' encoding='utf-8'?>")

Try

'Build the GeoRSS feed

rssOutput.AppendLine("<feed xmlns='http://www.w3.org/2005/Atom'")

rssOutput.AppendLine("xmlns:georss='http://www.georss.org/georss'")

rssOutput.AppendLine("xmlns:gml='http://www.opengis.net/gml'>")

rssOutput.AppendLine("<title>BeanieTracker</title>")

rssOutput.AppendLine("<subtitle>Beanie Locations</subtitle>")

rssOutput.AppendLine("<link href='http://localhost/beanietracker/'/>")

rssOutput.AppendLine("<updated>" + System.DateTime.Now + "</updated>")

rssOutput.AppendLine("<author>")

rssOutput.AppendLine("<name>Graeme Malcolm</name>")

rssOutput.AppendLine("</author>")

Dim dataParam As String = context.Request.QueryString("data")

If Not dataParam Is Nothing Then

If dataParam = "locations" Then

GetPhotos(rssOutput)

ElseIf dataParam = "countries" Then

GetCountries(rssOutput)

Else

Throw New Exception("Invalid parameter")

End If

End If

'Close the <feed> document and send it as the response

rssOutput.Append("</feed>")

context.Response.Write(rssOutput.ToString())

Catch e As Exception

OutputError(e.ToString(), context)

End Try

End Sub


Private Sub GetPhotos(ByRef rssOutput As System.Text.StringBuilder)

Using sqlConn As New SqlConnection(connStr)

'Open a connection to the database

sqlConn.Open()

Dim spName As String

'Use the GetPhotosGML stored proc to get all stores by default

spName = "GetPhotosGML"

Using cmd As New SqlCommand()

cmd.Connection = sqlConn

cmd.CommandType = Data.CommandType.StoredProcedure

'Specify the stored procedure name as the command text

cmd.CommandText = spName

Using geomRdr As SqlDataReader = cmd.ExecuteReader()

'Read the DataReader to process each row

While (geomRdr.Read())

'Create an <entry> element for this row

rssOutput.AppendLine("<entry>")

rssOutput.AppendLine(String.Format("<title>{0}</title>", geomRdr.GetValue(1)))

rssOutput.AppendLine(String.Format("<description>&lt;img
src='Photo.aspx?PhotoID={0}' height='100'/&gt;&lt;p&gt;{1} km from
home&lt;/p&gt;</description>", _

geomRdr.GetValue(0), geomRdr.GetValue(3)))

'Add a <georss:where> element

rssOutput.AppendLine("<georss:where>")

Dim gml As String

'Get the geography instance GML from column 2

gml = geomRdr.GetValue(2).ToString()

'Append the gml: prefix to all the elements due to VE parsing behavior

gml = gml.Replace("<", "<gml:")

gml = gml.Replace("gml:/", "/gml:")

'Add the <gml:> elements to the output XML

rssOutput.AppendLine(gml)

'Close <georss:where> and <entry> elements

rssOutput.AppendLine("</georss:where>")

rssOutput.AppendLine("</entry>")

End While

End Using

End Using

End Using

End Sub


Private Sub GetCountries(ByRef rssOutput As System.Text.StringBuilder)

Using sqlConn As New SqlConnection(connStr)

'Open a connection to the database

sqlConn.Open()

Dim spName As String

'Use the GetPhotosGML stored proc to get all stores by default

spName = "GetCountriesGML"

Using cmd As New SqlCommand()

cmd.Connection = sqlConn

cmd.CommandType = Data.CommandType.StoredProcedure

'Specify the stored procedure name as the command text

cmd.CommandText = spName

Using geomRdr As SqlDataReader = cmd.ExecuteReader()

'Read the DataReader to process each row

While (geomRdr.Read())

'Create an <entry> element for this row

rssOutput.AppendLine("<entry>")

'Use columns 0 and 1 for the title and description

rssOutput.AppendLine(String.Format("<title>{0}</title>", geomRdr.GetValue(1)))

rssOutput.AppendLine(String.Format("<description>{0}</description>", _

geomRdr.GetValue(3)))

'Add a <georss:where> element

rssOutput.AppendLine("<georss:where>")

Dim gml As String

'Get the geography instance GML from column 2

gml = geomRdr.GetValue(2).ToString()

'Append the gml: prefix to all the elements due to VE parsing behavior

gml = gml.Replace("<", "<gml:")

gml = gml.Replace("gml:/", "/gml:")

'Add the <gml:> elements to the output XML

rssOutput.AppendLine(gml)

'Close <georss:where> and <entry> elements

rssOutput.AppendLine("</georss:where>")

rssOutput.AppendLine("</entry>")

End While

End Using

End Using

End Using

End Sub

The code merges the GML results from the stored procedures into an XML feed, which is built up using simple string concatenation. You could use an XmlDocument or XmlWriter for this (or you could even use SQL Server's native XML support to generate the complete XML in the stored procedures), but this approach makes it easier to see what's going on. Note that SQL Server includes a gml:http://www.opengis.net/gml namespace declaration in the query results. However, the Virtual Earth map contol appears to require that all namespaces be declared in the root element of the feed, so I had to add code to strip out the namespace in the query results.

Next I needed to register the HTTP handler so that any requests for URLs with the extension .georss are handled by the custom handler, and not treated as regular ASP.NET pages. There's nothing special about the extension .georss by the way, I just chose to use that for my handler. To register a custom handler, you need to edit the Web.Config of your ASP.NET application. The specific entry you need to create depends on whether you are using IIS 6 or IIS 7 - see this KB article for more information. The configuration I used is shown here:


<httpHandlers>

<!--Register the GeoRSSHandler for .georss requests -->

<add verb="*" path="*.georss" type="GeoRSSHandler" validate="false"/>

</httpHandlers>

Finally, I needed to create some client-side Javascript to retrieve the feed and import it into the Virtual Earth map control. Here are the functions to do this (one to retrieve the photo locations feed, and one to retrieve the countries feed):

function ShowBeanieLocations()
{
try
{
map.DeleteAllShapes();
// Import GeoRSS feed of location data, and call onBeanieLocationsLoad function
when the data is loaded
var veLayerSpec = new VEShapeSourceSpecification(VEDataType.GeoRSS,"./Beanie.georss?data=locations");
map.ImportShapeLayerData(veLayerSpec, onBeanieLocationsLoad, true);
}
catch(e)
{
document.getElementById("Info").innerHTML = e.Message;
}
}

function ShowCountries()
{
try
{
map.DeleteAllShapes();
// Import GeoRSS feed of country data, and call onCountriesLoad function when the data is loaded
var veLayerSpec = new VEShapeSourceSpecification(VEDataType.GeoRSS,"./Beanie.georss?data=countries");
map.ImportShapeLayerData(veLayerSpec, onCountriesLoad, true);
}
catch (e)
{
document.getElementById("Info").innerHTML = e.Message;
}
}

Both of these functions follow the same basic procedure:

  1. Clear all existing shapes from the map control
  2. Retrieve the feed by requesting a .georss file wth the appropriate parameter (note that the actual file name is unimportant, the custom handler handles all .georss requests)
  3. Import the feed into the map control as a shape layer by using the ImportShapeLayerData method

The ImportShapeLayerData method is asynchronous, so a callback function to be run when the impoprt has completed is specified. Here are the callback functions in the Beanie Tracker application:

function onBeanieLocationsLoad(feed)
{
// Count the shapes returned
var locationcount = feed.GetShapeCount();
document.getElementById("Info").innerHTML = 'Beanie has visited ' +
locationcount + ' places.';
}

function onCountriesLoad(feed)
{
/ / Count the shapes returned
var locationcount = feed.GetShapeCount();
for (i=0;i<locationcount;i++)
{
var s = feed.GetShapeByIndex(i);
s.SetLineColor(new VEColor(0, 0, 0, 0));
var numVisits = s.GetDescription();
s.SetDescription("Beanie has visited this country " + numVisits + " times.");
var transparency = (numVisits % 9) / 10;
s.SetFillColor(new VEColor(255, 50, 100, transparency));
s.SetCustomIcon("<img src='images/transparentIcon.png'>" + numVisits +
"</img>");
}
document.getElementById("Info").innerHTML = 'The darker the country, the more times Beanie has visited it.';
}

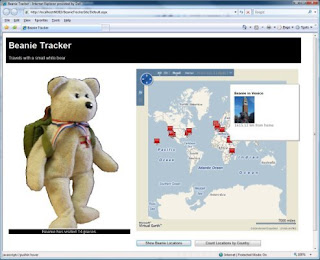
The callback function for the photo location data feed just counts the number of shapes (which will be rendered as push pins on the map by default since they are all points defined by a single lat/long pair) and displays the total. The callback for the countries data is a little more complicated - The elements returned are polygons, and so will be rendered as shapes of countries on the map; the code changes the transparency property of each shape to reflect the number of visits Beanie has made to the country, so that the more visits Beanie has made, the darker the country will appear. Note that by default a pushpin is displayed in the center of the shape, but I've used the SetCustomIcon method to specify that a transparent image should be used instead and included the number of visits as text, so that's what appears on the map.

The last step is to hook the methods that retrieve the feeds up to the buttons on the Web page:

<input id="Button1" type="button" value="Show Beanie Locations"
onclick="javascript:ShowBeanieLocations()" />

<input id="Button2" type="button" value="Count Locations by Country:"
onclick="javascript:ShowCountries()"/>

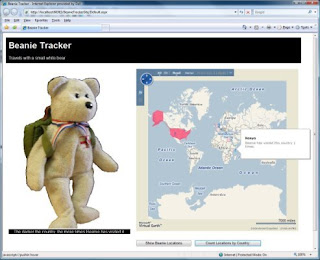
The resulting page is shown here:


One minor issue I had to deal with is that the ImportShapeLayerData method of the Virtual Earth map control does not seem to handle MultiSurface GML elements in the GeoRSS feed. I had to change the spatial data for countries with multiple land masses to a single polygon in the database by adding a very thin line between each land mass. If anyone knows of a workaround for this, I'd love to hear about it!

Adventures in Spatial Data - Part 1

As part of my job at Content Master, I get to play around with some pretty cool new technologies. Unfortunately, I usually need to do this to a fairly tight deadline; and often at the end of a project I'm left feeling that I'd like to have a bit more time to dig a little deeper. Recently I completed some marketing collateral and Hands-On Labs on Spatial Data in SQL Server 2008 for the SQL Server Marketing team at Microsoft, and of all the technologies and products I've looked at recently, I find myself fascinated with this one. I've always been impressed with technology that's actually useful, so I've decided going to play around with spatial data to see what I can come up with. I should warn you, I'm not a GIS specialist, but I love that I can now incorporate geographical data into SQL Server databases - even with SQL Server Express Edition.

As a basic context for learning about this stuff, I've decided to create a simple Web-based application that combines spatial data in SQL Server 2008 with Virtual Earth. Specifically, it will track the travels of Beanie - a small white bear that we've had in our family for a number of years and who gets taken with us wherever we go (it's a long story!). Here's Beanie:

The Web application is available at http://www.graemesplace.com/beanietracker.htm, and I'll spend the next couple of blog articles dissecting it (and probably making changes to it as I go).

OK, so let's cover a few basics first. Spatial data support is new in SQL Server 2008, and takes the form of two new data types: geometry and geography. The first of these is designed to handle planar spatial data (i.e. points, lines and shapes on a flat surface), while the second is for geodetic spatial data (i.e. points, lines, and shapes on the surface of a spheroid - specifically the planet Earth). The data types ar quite similar to one another, and expose many of the same methods and properties - key differences between them include:
  • The geometry type uses arbitrary x and y coordinates to define spatial elements within a bounded flat area, while the geography type uses longitude and latitude coordinates to define spatial elements on the surface of the Earth.
  • The geometry type uses basic pythagorean mathematics to calculate distances between points, while the geography type accounts for the curvature of the Earth when calculating distances.
Since I want to integrate my data with Virtual Earth, it makes most sense to use the geography type for Beanie's travel data.

The first thing I need to do is to define the database objects for my application. For this aplication, I want to store the locations that Beanie has visited as a longitude/latitude point (along with information about the location and a photograph of Beanie there - just in case you thought I was making this up!)
So, here's the definition for the Photos table:
CREATE TABLE Photos
([PhotoID] int IDENTITY PRIMARY KEY,
[Description] nvarchar(200),
[Photo] varbinary(max),
[Location] geography)
GO


Note the Location column, which is defined as geography. All of the locations in this table will be simple long/lat points rather than lines or shapes, but the geography type will store any valid geography instance.

To insert a location, I can choose from a number of ways to parse the spatial data - depending on the format I have it in. For example, here's an INSERT statement that inserts a geography instance from a text-based decription of a point:
INSERT INTO Photos
([Description], Photo, Location)
VALUES
('Beanie in Las Vegas',
(SELECT * FROM OPENROWSET(BULK N'C:\BeanieTracker\3.JPG', SINGLE_BLOB) As [Photo]),
geography::STPointFromText('POINT (-115.1765 36.1132)', 4326))

Note the use of the STPointFromText static method. This parses the spatial text description, which must specify coordinates in longitude - latitude order. Note also the number 4326 specified as the Spatial Reference ID (SRID) - this is a code that determines the specific geodetic model that the coordinates are based on (in this case, 4326 indicates the WGS84 spheroid model used by GPS systems. There are a few different models, largely because it's difficult to be exact about what shape the Earth actually is! There's a useful article on this
here that might help if you're interested in learning more about ellipsoid models.)

Spatial data is commonly available in Geographic Markup Language (GML) format - an XML syntax for describing geospatial elements, and you can also insert data in this format as shown here:

INSERT INTO Photos
([Description], Photo, Location)
VALUES
('Beanie at Edinburgh Castle',
(SELECT * FROM OPENROWSET(BULK N'C:\BeanieTracker\2.JPG', SINGLE_BLOB) As [Photo]),
geography::GeomFromGml
('<Point xmlns="http://www.opengis.net/gml">
<pos>55.9486 -3.2005</pos>
</Point>'
, 4326))


Note the use of the GeomFromGml static method in this code, and also note that this time the coordinates are in latitude - longitude order. The reason for the inconsistancy stems from a late-breaking change in spatial data support in SQL Server 2008 (see
Isaac Kunen's blog article about this).

The next thing I need in the application is another table in which to store details about countries. The reason I need this is that I want to be able to find out how many locations Beanie has visited within each country, and show them visually on a map. I'll store the shapes of the countries as polygons - in terms of the database schema, I can use another geography column, since the data type can handle polygons and lines as well as points. here's the table definition:
CREATE TABLE Countries
(CountryID INT IDENTITY PRIMARY KEY,
CountryName nvarchar(255),
CountryShape geography)


To insert the polygon data, I can use the same basic approaches I used for the long/lat points in the Photos table. All I need to do is to describe the polygon as a sequence of points, as shown in this example:
INSERT INTO Countries
(CountryName, CountryShape)
VALUES
('France',
geography::STPolyFromText
('POLYGON
((
2.109375 51.01375465718818,
0.615234375 50.17689812200107,
-0.439453125 49.439556958940855,
-1.2744140625 49.837982453084834,
-2.1533203125 49.696061819115634,
-2.28515625 48.893615361480194,
-4.9658203125 48.83579746243093,
-4.5703125 47.635783590864854,
-3.1640625 47.487513008956554,
-1.6259765625 46.07323062540835,
-1.3623046875 44.809121700077355,
-1.845703125 43.32517767999296,
0.615234375 42.682435398386204,
3.0322265625 42.42345651793833,
4.2626953125 43.421008829947254,
6.2841796875 42.74701217318067,
7.6025390625 43.7393520791547,
6.943359375 44.37098696297173,
6.6357421875 45.182036837015886,
6.5478515625 46.49839225859763,
5.9765625 46.13417004624326,
6.328125 46.6795944656402,
7.119140625 47.57652571374621,
8.2177734375 48.951366470947725,
6.5478515625 49.32512199104001,
4.833984375 50.064191736659104,
4.21875 49.89463439573421,
4.1748046875 50.3734961443035,
2.98828125 50.62507306341437,
2.109375 51.01375465718818
))', 4326)
)

As before, I can also import the data in GML format:

INSERT INTO Countries
(CountryName, CountryShape)
VALUES
('Egypt',
geography::GeomFromGml
(
'<Polygon xmlns="http://www.opengis.net/gml">
<exterior>
<LinearRing>
<posList>
31.57853542647338 24.9609375
31.128199299111959 24.697265625
30.524413269923986 24.9609375
30.221101852485983 24.609375
29.152161283318915 24.9609375
21.94304553343818 24.9609375
21.983801417384697 34.1015625
23.140359987886114 35.6396484375
27.9361805667694 34.43115234375
29.535229562948469 34.892578125
31.278550858946531 34.21142578125
31.222197032103196 32.32177734375
1.597252561706661 31.1572265625
30.939924331023441 28.76220703125
31.57853542647338 24.9609375
</posList>
</LinearRing>
</exterior>
</Polygon>'
, 4326)
)


Again, note the difference in the ordering of the longitude and latitude coordinates between the two methods. Also note that you must describe the polygon as a sequence of coordinates that enclose the shape you want to store in a counter-clockwise direction. The reason for this requirement is to avoid ambiguity about the part of the Earth's surface you want to include in the shape and the rest of the Earth's surface. For example, look at the following picture:


Now, does this show a small red circle on a gray sphere, or does it show a large gray area that covers most of a red sphere? By using the convention of describing polygons by enclosing them in a counter-clockwise direction, you can be unambiguous about which shape you're describing. Additionally, if you try to define a shape that is larger than a hemisphere, the geography type will raise an exception - and this is often happens when you describe polygon in the wrong direction by mistake. See this article in Ed Katibah's blog for an interesting discussion about this.
OK, back to our database - and an interesting problem. Some countries consist of more than one landmass. In other words, they include multiple polygons. Fortunately, the geography data type can handle this scenario as shown in the following code, which creates a geography instance for the United States that includes the mainland US, Alaska, and Hawaii:
INSERTINTO Countries
(CountryName, CountryShape)
VALUES
('United States of America',
geography::STMPolyFromText
('MULTIPOLYGON(
((-123.07402588363084 37.767367310117017,
-121.94097917688177 36.490937923858858,
-120.37149732826121 34.045890710439785,
-117.16155430516534 32.715680633728539,
-115.13671875 32.54681317351514,
-110.390625 31.203404950917395,
-108.6328125 31.653381399664,
-106.47549795243778 31.733844355633792,
-103.7109375 29.075375179558346,
-101.56221503336745 29.807382670042525,
-100.89817721206964 29.366207091173063,
-99.501983817857962 27.530904416002304,
-97.505157798460743 25.866221792519891,
-97.149468867243158 25.943457571654395,
-97.176960378652467 27.675151290420871,
-93.894849576786243 29.732981419413576,
-90.506037559706073 29.06303206938912,
-89.12109375 30.353916372297035,
-86.1328125 30.27804437780013,
-85.2099609375 29.649868677972303,
-83.95751953125 29.99300228455108,
-81.780293310096368 24.5583430193,
-80.134852769446283 25.792769876534258,
-80.101951906484146 26.931995972872219,
-80.606873856214719 28.079387728938791,
-80.537540582081022 28.470839206510636,
-80.749057521104547 32.189103634193479,
-75.984925610664732 35.373785353022406,
-71.591597672350787 41.189858770922925,
-70.3056301459883 41.801225588436182,
-66.967327818020152 44.812878222881466,
-69.154285648166763 47.454989805995105,
-71.538670536472367 44.99637100669522,
-74.735724992604418 45.028448990132183,
-77.250621135570626 43.995140406452222,
-79.064274837925424 43.10662863009243,
-78.878439231461826 42.88544317671419,
-82.652583599187864 41.76926713330969,
-84.347939004022578 46.518294248124974,
-89.245498827623535 48.381706457487851,
-102.54842574981625 49.00235529594778,
-122.7588943299908 48.976728632317268,
-123.14601579176878 48.165524140067781,
-123.43134011415688 48.118720268780265,
-124.73518224557731 48.391678533676071,
-123.07402588363084 37.767367310117017)),
((-141.15234375 59.88893689676585,
-141.50390625 70.08056215839737,
-156.68701171875 71.43417616304582,
-168.3984375 68.84766505841037,
-164.8828125 66.99884379185184,
-169.1015625 65.58572002329472,
-164.70703125 63.704722429433225,
-169.1015625 60.23981116999892,
-162.59765625 58.17070248348609,
-171.5625 51.83577752045248,
-153.6328125 56.072035471800866,
-148.0078125 59.44507509904714,
-141.15234375 59.88893689676585)),
((-159.169921875 22.411028521558702,
-159.85107421875 22.380555501421533,
-160.400390625 21.80030805097259,
-158.26904296875 21.238182425982312,
-157.08251953125 20.80747157680652,
-156.741943359375 20.478481600090564,
-156.02783203125 20.262197124246533,
-156.2255859375 19.673625561844392,
-155.819091796875 18.781516724349703,
-154.632568359375 19.383704634148017,
-155.8740234375 20.848545148787234,
-157.8955078125 21.749295836732088,
-159.2138671875 22.27893059841188,
-159.169921875 22.411028521558702))
)', 4326)
)
Note the use of the STMPolyFromText method, which includes a text description of three polygons. Of course, you can also use GML for this, as shown in the following code to define two polygons for the United Kingdom of Great Britain and Northern Ireland:

INSERT INTO Countries
(CountryName, CountryShape)
VALUES
('United Kingdom',
geography::GeomFromGml
('<MultiSurface xmlns="http://www.opengis.net/gml">
<surfaceMembers>
<Polygon>
<exterior>
<LinearRing>
<posList>
58.813741715707813 -5.09765625
58.539594766640484 -6.6796875
57.704147234341931 -7.998046875
56.022948079627454 -6.767578125
55.379110448010472 -6.15234375
55.07836723201514 -5.361328125
54.162433968067809 -3.779296875
53.540307391500221 -3.251953125
53.44880683542759 -4.7021484375
52.696361078274485 -4.98779296875
52.749593726741139 -4.24072265625
52.308478623663355 -4.2626953125
51.944264879028765 -5.38330078125
51.440312757160115 -5.07568359375
51.508742458803319 -3.955078125
51.358061573190916 -3.5595703125
51.303145259199056 -3.1640625
51.206883394865621 -4.482421875
50.007739014636869 -5.99853515625
49.908787000867136 -5.0537109375
50.247204901392671 -4.24072265625
50.12057809796007 -3.69140625
50.471490851399558 -2.13134765625
50.583236614805884 -0.72509765625
50.861444110589233 1.12060546875
51.23440735163458 1.64794921875
51.577069537225668 1.0546875
52.1874047455997 1.77978515625
52.816043191549333 1.82373046875
53.054421865461023 0.615234375
52.948637884883205 0.3076171875
53.278353017531821 0.41748046875
54.610254981579146 -0.615234375
54.711928848406139 -1.12060546875
55.615589025267482 -1.51611328125
56.084297562061408 -2.63671875
55.986091533808384 -3.2080078125
56.022948079627454 -3.69140625
56.059769479106571 -3.22998046875
56.279960831728459 -2.548828125
56.389583525613055 -2.79052734375
57.112385007934009 -2.021484375
57.680660029772348 -1.73583984375
57.715885127745032 -3.8232421875
57.879816455278409 -3.7353515625
57.879816455278409 -3.955078125
58.562522728537338 -2.8125
58.813741715707813 -5.09765625
</posList>
</LinearRing>
</exterior>
</Polygon>
<Polygon>
<exterior>
<LinearRing>
<posList>
55.354135310210573 -7.31689453125
55.028022112992517 -7.4267578125
54.762670400254947 -7.646484375
54.711928848406139 -7.91015625
54.635697306063854 -7.93212890625
54.610254981579146 -7.7783203125
54.482804559582554 -8.173828125
54.1109429427243 -7.53662109375
54.188155481071512 -7.20703125
54.380557368630654 -7.03125
54.213861000644926 -6.85546875
54.188155481071512 -6.7236328125
54.046489113355761 -6.70166015625
54.033586335210849 -6.08642578125
54.393352223845881 -5.38330078125
54.800684867322332 -5.55908203125
54.863962939854758 -5.82275390625
55.216490131689788 -6.1083984375
55.241552035652518 -6.87744140625
55.354135310210573 -7.31689453125
</posList>
</LinearRing>
</exterior>
</Polygon>
</surfaceMembers>
</MultiSurface>
'
,4326)
)

After you've inserted your spatial data, you can query it in Transact-SQL. SQL Server Management Studio includes a pretty cool visualizer that lets you see your spatial data projected as a map:

You can retrieve spatial data in Binary, Text, or GML format as shown by the following queries and results:

SELECT [Description], [location]
FROM Photos

Results:
Beanie at Edinburgh Castle 0xE6100000010C287E8CB96BF94B40B4C876BE9F9A09C0
Beanie in Las Vegas 0xE6100000010C1FF46C567D0E42409EEFA7C64BCB5CC0


SELECT [Description], [location].ToString()
FROM Photos

Results:
Beanie at Edinburgh Castle POINT (-3.2005 55.9486)
Beanie in Las Vegas POINT (-115.1765 36.1132


SELECT [Description], [location].AsGml()
FROM Photos

Results:
Beanie at Edinburgh Castle<Point xmlns="http://www.opengis.net/gml"><pos>55.9486 -3.2005</pos></Point>
Beanie in Las Vegas<Point xmlns="http://www.opengis.net/gml"><pos>-115.1765 36.1132<pos></Point>

Of course, if the spatial support in SQL Server 2008 only enabled you to store and retrieve spatial objects, it would be of limited use. After all, you could just as easily store this data as text or XML. The real advantage of spatial data support is the ability to perform spatial operations on the data, and ask location-related questions such as "How many times has Beanie been in each country?" (or "What are the sales volumes for each sales region?" if you prefer) and "How far is this place from Beanie's home?"(or "Where's the nearest store to a customer's current location?"). Here are a couple of code samples that shpow how these kinds of query can be performed by using the instance methods of the geography data type.
-- Function to get the distance of any point from Beanie's home in Dunfermline, Scotland
CREATE FUNCTION GetDistanceFromHome (@location geography)
RETURNS float
AS
BEGIN
DECLARE @home geography;
SET @home = geography::STPointFromText('POINT(-3.408304452896118 56.06143472072096)', 4326)
DECLARE @dist float;
SET @dist = ROUND(@home.STDistance(@location)/1000, 2)
RETURN @dist
END
GO
-- Stored procedure to return all photos and their locations
CREATE PROCEDURE GetPhotosGML
AS
-- Return the location geography data as GML
SELECT [PhotoID], [Description], [Location].AsGml() As PhotoGML,
(SELECT dbo.GetDistanceFromHome(Location)) AS DistanceFromHome
FROM Photos
GO

EXEC GetPhotosGML

Results:
PhotoIDDescriptionPhotoGMLDistanceFromHome
2Beanie at Edinburgh Castle<Point xmlns="http://www.opengis.net/gml"><pos>55.9486 -3.2005</pos></Point>18.05
3Beanie in Las Vegas<Point xmlns="http://www.opengis.net/gml"><pos>36.1132 -115.1765</pos></Point>7940.86


SELECT c.CountryName, Count(p.PhotoID) Visits
FROMPhotos p, Countries c
WHERE p.Location.STIntersects(c.CountryShape) = 1
GROUP BY c.CountryName
Results:
CountryName Visits
Egypt 2
France 1


So, hopefully you've enjoyed this little exploration of spatial data in SQL Server 2008. The database code for the Beanie Tracker application is available from
http://cid-ddad9079cff45619.skydrive.live.com/self.aspx/Public/BeanieTracker.zip if you want to play with it yourself. You'll need SQL Server 2008 (you can get the Express Edition for free from http://www.microsoft.com/sqlserver/2008/en/us/express.aspx).
Next time, I'll describe the Web application and how to visualize your spatial data with the Virtual Earth map control.