Sunday 27 December 2009

Multi-Server Management with SQL Server 2008 R2

A key challenge for many medium to large businesses is the management of multiple database server instances across the organization. SQL Server has always had a pretty good story with regards to multi-server management through automated multi-server jobs, event forwarding, and the ability to manage multiple instances from a single administrative console. In SQL Server 2008, Microsoft introduced a new solution called Data Collector for gathering key server performance data and centralizing it in a management data warehouse; and in SQL Server 2008 R2, this technology underpins a new way to proactively manage server resources across the enterprise.

With SQL Server 2008 R2, database administrators can define a central utility control point (UCP) and then enroll SQL Server instances from across the organization to create a single, central dashboard view of server resource utilization based on policy settings that determine whether a particular resource is being over, under, or well utilized. So for example, a database administrator in an organization with multiple database servers can see at a glance whether or not overall storage and CPU resources across the entire organization are being utilized appropriately, and can drill-down into specific SQL Server instances where over or under utilization is occurring to identify where more resources are required (or where there is spare capacity).

Sounds pretty powerful, right? So you’d expect it to be complicated to set up and configure. However, as I hope to show in this article, it’s actually pretty straightforward. In SQL Server Management Studio, there’s a new tab named Utility Explorer, and a Getting Started window that includes shortcuts to wizards that you can use to set up a UCP and enroll additional server instances.

Picture1

Clicking the Create a Utility Control Point link starts the following wizard:

Picture2

The first step is to specify the SQL Server instance that you want to designate as a UCP. This server instance will host the central system management data warehouse where the resource utilization and health data will be stored.

Picture3

Next you need to specify the account that will be used to run the data collection process. This must be a domain account rather than a built-in system account (you can specify the account that the SQL Server Agent runs as, but again this must be a domain account).

Picture4

Now the wizard runs a number of verification checks as shown here:

Picture5

Assuming all of the verification checks succeed, you’re now ready to create the UCP.

Picture6

The wizard finally performs the tasks that are required to set up the UCP and create the management data warehouse.

Picture7

After you’ve created the UCP, you can view the Utility Control Content window to see the overall health of all enrolled SQL Server instances. At this point, the only enrolled instance is the UCP instance itself, and unless you’ve waited for a considerable amount of time, there will be no data available. However, you can at least see the dashboard view and note that it shows the resource utilization levels for all managed instances and data-tier applications (another new concept in SQL Server 2008 R2 – think of them as the unit of deployment for a database application, including the database itself plus any server-level resources, such as logins, that it depends on).

Picture8

To enroll a SQL Server instance, you can go back to the Getting Started window and click Enroll Instances of SQL Server with a UCP. This starts the following wizard:

Picture9

As before, the first step is the specify the instance you want to enroll. I’ve enrolled a named instance on the same physical server (actually, it’s a virtual server but that’s not really important!), but you can of course enroll any instance of SQL Server 2008 R2 in your organization (It’s quite likely that other versions of SQL Server will be supported in the final release, but in the November CTP only SQL Server 2008 R2 is supported).

Picture10

As before, the wizard performs a number of validation checks.

Picture11

Then you’re ready to enroll the instance.

Picture12

The wizard performs the necessary tasks, including setting up the collection set on the target instance.

Picture13

When you’ve enrolled all of the instances you want to manage, you can view the overall database server resource health from a single dashboard.

Picture14

In this case, I have enrolled two server instances (the UCP itself plus one other instance) and I’ve deliberately filled a test database. Additionally, the virtual machine on which I installed these instances has a small amount of available disk space. As a result, you can see that there is some over-utilization of database files and storage volumes in my “datacenter”. To troubleshoot this overutilization, and find the source of the problem, I can click the Managed Instances node in the Utility Explorer window and select any instances that show over (or under) utilization to get a more detailed view.

Picture15

Of course, your definition of “over” or “under” utilized might differ from mine (or Microsoft’s!), you can configure the thresholds for the policies that are used to monitor resource utilization , along with how often the data is sampled and how many policy violations must occur in a specified period before the resource is reported as over/under utilized.

Picture16

These policy settings are global, and therefore apply to all managed instances. You can set individual policy settings to override the global polices for specific instances, though that does add to the administrative workload and should probably be considered the exception rather than the rule.

My experiment with utility control point-based multi-server management was conducted with the November community technology preview (CTP), and I did encounter the odd problem with collector sets failing to upload data. However, assuming these kinks are ironed out in the final release (or were caused by some basic configuration error of my own!), this looks to be the natural evolution of the data collector that was introduced in SQL Server 2008, and should ease the administrative workload for many database administrators.

Thursday 24 December 2009

Further Adventures in Spatial Data with SQL Server 2008 R2

Wow! Doesn’t time fly? In November last year I posted the first in a series of blog articles about spatial data in SQL Server 2008. Now here we are over a year later, and I’m working with the November CTP of SQL Server 2008 R2. R2 brings a wealth of enhancements and new features – particularly in the areas of multi-server manageability, data warehouse scalability, and self-service business intelligence. Among the new features that aren’t perhaps getting as much of the spotlight as they deserve, is the newly added support for including maps containing spatial data in SQL Server Reporting Services reports. This enables organizations that have taken advantage of the spatial data support in SQL Server 2008 to visualize that data in reports.

So, let’s take a look at a simple example of how you might create a report that includes spatial data in a map. I’ll base this example on the same Beanie Tracker application I created in the previous examples. To refresh your memory, this application tracks the voyages of a small stuffed bear named Beanie by storing photographs and geo-location data in a SQL Server 2008 database. You can download the script and supporting files you need to create and populate the database from here. The database includes the following two tables:

-- Create a table for photo records
CREATE TABLE Photos
([PhotoID] int IDENTITY PRIMARY KEY,
[Description] nvarchar(200),
[Photo] varbinary(max),
[Location] geography)
GO

-- Create a table to hold country data
CREATE TABLE Countries
(CountryID INT IDENTITY PRIMARY KEY,
CountryName nvarchar(255),
CountryShape geography)
GO

The data in the Photos table includes a Location field that stores the lat/long position where the photograph was taken as a geography point. The Countries table includes a CountryShape field that stores the outline of each country as a geography polygon. This enables me to use the following Transact-SQL query to retrieve the name, country shape, and number of times Beanie has had his photograph taken in each country:

SELECT CountryName,
CountryShape,
(SELECT COUNT(*)
FROM Photos p
WHERE (Location.STIntersects(c.CountryShape) = 1))
AS Visits
FROM Countries c

With the sample data in the database, this query produces the following results:

CountryNameCountryShapeVisits
France0xE6100000 … (geography data in binary format)1
Egypt0xE6100000 … (geography data in binary format)2
Kenya0xE6100000 … (geography data in binary format)1
Italy0xE6100000 … (geography data in binary format)2
United States of America0xE6100000 … (geography data in binary format)7
United Kingdom0xE6100000 … (geography data in binary format)2

To display the results of this query graphically on a map, you can use SQL Server Business intelligence Development Studio or the new Report Builder 3.0 application that ships with SQL Server 2008 R2 Reporting Services. I’ll use Report Builder 3.0, which you can install by using Internet Explorer to browse to the Report Manager interface for the SQL Server 2008 R2 Reporting Services instance where you want to create the report (typically http://<servername>/reports) and clicking the Report Builder button.

When you first start Report Builder 3.0, the new report or dataset page is displayed as shown below (if not, you can start it by clicking New on the Report Builder’s main menu).

Picture1

This page includes an option for the Map Wizard, which provides an easy way to create a report that includes geographic data. To start the wizard, select the Map Wizard option and click Create. This opens the following page:

Picture2

SQL Server 2008 R2 Reporting Services comes with a pre-populated gallery of maps that you can use in your reports. Alternatively, you can import an Environmental Systems Research Institute (ESRI) shapefile, or you can so what I’m doing and use a query that returns spatial data from a SQL Server 2008 database.

After selecting SQL Server spatial query and clicking Next, you can choose an existing dataset or select the option to create a new one. Since I don’t have an existing dataset, I’ll select the option to Add a new dataset with SQL Server spatial data and click Next, and then create a new data source as shown here:

Picture4

On the next screen of the wizard, you can choose an existing table, view, or stored procedure as the source of your data, or you can click Edit as Text to enter your own Transact-SQL query as I’ve done here:

Picture5

The next page enables you to select the spatial data field that you want to display, and provides a preview of the resulting map that will be included in the report.

Picture6

Note that you can choose to embed the spatial data in the report, which increases the report size but ensures that the spatial map data is always available in the report. You can also add a Bing Maps layer, which enables you to “superimpose” your spatial and analytical data over Bing Maps tiles as shown here:

Picture7

Next you can choose the type of map visualization you want to display. These include:

  • Basic Map: A simple visual map that shows geographical areas, lines, and points.
  • Color Analytical Map: a map in which different colors are used to indicate analytical data values (for example, you could use a color range to show sales by region in which more intense colors indicate higher sales)
  • Bubble Map: A map in which the center point of each geographic object is shown as a bubble, the size or color of which indicates an analytical value.

Picture8

To show the number of times Beanie has visited a country, I’m using a bubble map. Since the bubbles must be based on a data value, I must now choose the dataset that contains the values that determine the size of the bubbles.

Picture9

Having chosen the dataset, I now get a confirm or chance to change the default matches that the wizard has detected.

Picture10

Finally, you can choose a visual theme for the map and specify which analytical fields determine bubble size and the fill colors used for the spatial objects.

Picture11

Clicking Finish, generates the report, which you can make further changes to with Report Builder.

Picture12

Selecting the map reveals a floating window that you can use to edit the map layers or move the area of the map that is visible in the map viewport (the rectangle in which the map is displayed).

Picture13

You can make changes to the way the map and its analytical data are displayed by selecting the various options on the layer menus. For example, you can:

  • Click Polygon Properties to specify a data value to be displayed as a tooltip for the spatial shapes on the map.
  • Click Polygon Color Rule to change the rule used to determine the fill colors of the spatial shapes on the map.
  • Click Center Point Properties to add labels to each center point “bubble” on the map.
  • Click Center Point Color Rule to change the rule used to determine the color of the bubbles, including the scale of colors to use and how the values are distributed within that scale.
  • Click Center Point Size Rule to change the rule used to determine the size of the bubbles, including the scale of sizes to use and how the values are distributed within that scale.
  • Click Center Point Marker Type Rule to change the rule used to determine the shape or image of the bubbles, including a range of shapes or images to use and how the values are matched to shapes or images in that range.

At any time, you can preview the report in Report builder by clicking Run. Here’s how my report looks when previewed.

Picture14

When you’re ready to publish the report to the report server, click Save on the main menu, and then click Recent Sites and Servers in the Save As Report dialog box to save the report to an appropriate folder on the report server.

Picture15

After the report has been published, users can view it in their Web browser through the Report manager interface. here’s my published report:

Picture16

I’ve only scratched the surface of what’s possible with the map visualization feature in SQL Server 2008 R2 Reporting Services. When combined with the spatial data support in SQL Server 2008 it really does provide a powerful way to deliver geographical analytics to business users, and hopefully you’ve seen from this article that it’s pretty easy to get up and running with spatial reporting.

Friday 14 August 2009

Windows Virtual PC

I've just installed Windows 7 and started to have a look at the new Windows Virtual PC. There are a couple of nice new features.

First of all, you can now save notes as part of the Virtual PC configuration file, so you can record any relevant information about the virtual machine. In addition to that you can also save the logon credentials for the virtual machine in the configuration file, so you don't have to worry about remembering passwords for all various virtual machines you might have.

Second, it's now much easier to access the contents of virtual hard drives without firing up a virtual machine. If you run the Windows disk management console (diskmgmt.msc), you'll see that there are two new options on the Actions menu that enable you to mount a virtual hard disk in Windows, and to create a brand new virtual hard disk. Once you’ve created your virtual hard disk, you can initialise it and format it just like any other disk on the system.

Thursday 13 August 2009

Windows API Code Pack v1.0 released

If you've been watching your Visual Studio Start Page in recent days, you'll have noticed this already; MS have released a code pack that shows how to implement a whole bunch of functionality, including some new Windows 7 functionality such as Jump Lists in the Start menu, toolbar progress indicators and toolbar thumbnail customisations, to name but a few.

I'm planning on spending some time in the coming days investigating how to implement some of this functionality, so expect some articles to pop up sharing my findings. For those that want to play for themselves, you can download the toolkit here

(http://code.msdn.microsoft.com/WindowsAPICodePack/Release/ProjectReleases.aspx?ReleaseId=3077)

The toolkit itself contains multiple projects and samples that show how to implement the functionality you're after. The code contained in the toolkit is fully distributable, however don't take my word for it, naturally...there's an EULA for a reason, folks!

Thursday 23 July 2009

Do functional programmers need design patterns?

“Elements of Reusable Object-Oriented Software” is a book that I am sure all self respecting software developers have read. The infamous Gang of Four book seems to shape everything we do in modern object oriented software development and by applying the principles contained within generally results in a quality software product.

One common (but slightly controversial) view on design patterns is that generally they only exist to patch up any shortcomings of the language. If a language can solve a problem in a trivial way then it may well have no need for a design pattern at all. This can be demonstrated by developments within the .NET Framework, for example the “Iterator” design pattern is embedded within the language through the IEnumerable interface, reducing the need to implement the pattern yourself.

Microsoft F#, due to ship with Visual Studio 2010, is primarily a functional programming language and supports all the features you would expect, such as functions as first-class values, currying and immutable values. As F# is fully integrated into the .NET framework it can also be used in an imperative or object oriented way.

So in a multi-paradigm language is there a need for software design patterns? Do we need to worry about design patterns in F#, and if so how do we apply them.

Some articles I have read recently have gone so far as to suggest that the design of functional languages eliminates the need for design patterns completely. This is however only partially correct.

There are some design patterns that are rendered obsolete by functional languages, take the Command pattern as an example. The Command pattern as documented by the Gang of Four enables you to:

encapsulate a request as an object, letting you parameterize clients with different requests”.

This is simply an approximation of a first-class function. In F# you would simply pass a function as the argument to another function.

In an object oriented language, you have to wrap up the function in a class, which you then instantiate and pass the resulting object to the other function. The effect is the same, but in the object oriented world it's called a design pattern.

The same can be said about the Abstract Factory pattern. The Abstract Factory enables you to:

Provide an interface for creating families of related or dependent objects without specifying their concrete classes”.

In F# this is known as currying. Currying is the process of transforming a function that takes multiple arguments into a function that takes just a single argument and returns another function if any arguments are still needed.

It is clear therefore that several design patterns are rendered redundant in F# because the language provides more powerful, succinct alternatives. There are however still design problems that are not solved within F#. There is no F# equivalent for the Singleton pattern for instance.

Interestingly it works the other way too. Functional languages have their own design patterns; you just tend not to think of them that way. You may have come across “Monads”, which are a kind of abstract data type and often used for handling global state within functional languages. This is a problem that is so simple to solve in object oriented languages that there is no equivalent design pattern.

So while it is true that some object oriented design patterns become redundant in functional code, many, such as MVC do not.

So if you’re working with F#, don’t forget about design patterns, you never know you may even come across some new ones.

Monday 13 July 2009

CardSpace and the Access Control Service

The Geneva Framework is designed to simplify the development of claims-aware applications that want to eternalize the authentication function. I wanted to the the Geneva Framework to help create an ASP.NET application that would enable users to authenticate with either a Windows Live ID or a CardSpace managed information card, and then apply some authorization rules that were defined in the Access Control Service (one of the cloud hosted .NET Services).

My initial working assumptions were:

1. The Windows Live ID authentication would use a passive mechanism (WS-Federation). My ASP.NET application (the Relying Party) would send an HTTP request to an Access Control Service (ACS) endpoint, which would then initiate a sequence of HTTP redirects to authenticate the user at www.live.com, and then deliver a set of authorization rules (claims) from ACS back to my application.

2. The CardSpace authentication would use an active mechanism (WS-Trust). The ASP.NET application would launch the CardSpace UI to enable the user to select a suitable card, which would then be delivered directly to ACS in a SOAP message. ACS would then examine the claims in the card and deliver a set of authorization rules (claims) from ACS back to my application.

Assumption 1 turned out to be valid, and easy to implement as there are plenty of available examples to work from. The only bit which is not perfect here is managing the sign out from Windows Live whilst remaining on a page of my ASP.NET application.

Assumption 2 however turned out to be problematic. The current version of CardSpace (a part of .NET Framework 3.5) will only work with a Security Token Service (STS) that returns at least 1 claim. Unfortunately the endpoint that ACS exposes has an associated policy that does not have any required claims – so CardSpace refuses to talk to it. The Geneva Framework includes a new (beta) version of Windows CardSpace which relaxes this restriction, but I then hit another obstacle: the ACS uses message security, but the new version of CardSpace currently only supports mixed-mode transport bindings. So again CardSpace will not talk to the ACS.

As a work around I reverted to using a passive approach for the CardSpace authentication. My ASP.NET website (the Relying Party) is configured to perform a passive logon to the ACS, but instead of the ACS redirecting to a Windows Live login page, it redirects to a login page on a custom STS (created using a template from the Geneva Framework). This custom STS operates as a proxy, and extracts the claims from the Information Card, before repackaging them as a new set of claims to send to the ACS in an HTTP redirect.

Hopefully, this will all be simplified in future releases of CardSpace and the ACS, when a direct login to the ACS using a managed card will be possible.

For anyone who’s interested I’ve posted some sample code and documentation here:

Thursday 9 July 2009

SharePoint, Search and Loopback Checking

Recently a client encountered a problem on a single server MOSS deployment on Windows Server 2008. After installing MOSS SP2 and some Windows updates, the client reported that:
  • The search service wasn't returning any results.
  • They couldn't access the SSP administration page from the server.

This turned out to be the loopback checking feature in IIS. This feature prevents you from accessing a Web site with a host header from the same machine - for example, you can access http://machinename/default.aspx, but not http://hostheader/default.aspx. When you attempt to access a site under these conditions, you'll be prompted for credentials three times and then have access denied with a 401.1 Unauthorized: Logon Failed error. The giveaway was that the Central Administration site was set up to use the machine name, whereas the SSP site was set up to use a host header.

Because this is a single server environment, the search service is attempting to crawl sites, by host header, that are hosted on the local machine. In each case, access is denied with a 401.1 error and you end up with a very empty search index.

This issue became a fairly well known problem for SharePoint administrators on Windows Server 2003 environments, and usually arose when the server was upgraded to SP1. I've never come across the issue in a Windows Server 2008 environment before - I guess an update must have triggered the loopback checking feature in IIS7, but I'm surprised it wasn't enabled already.

Anyway, I followed the workaround here (Method 1), restarted the IIS Admin service, started a full search crawl and we're up and running again.

Tuesday 23 June 2009

Free Quality Malware Protection from Microsoft

Microsoft has just released the Beta for their free malware protection product called "Windows Security Essentials" (Codenamed Morro).

This antivirus and anti-spyware program uses the same tried and tested scanning engine and signature updates as Windows OneCare (which goes away once MSE is out) and the ForeFront Client Security (Microsoft's business focused AV solution). It is available in 32bit and 64bit versions and has been optimized to provide a small system overhead and minimal user interface. This is in stark contrast to the bloated AV products available today from many of the main AV vendors.
Although this tool is intended as a consumer product it is difficult not to consider this in the SMB space as well, in the same way Windows Defender has become a standard part of most small business installations.
Those of you old enough, may well be asking yourself if this is going to be any different from the MS-AV farce in the days of MS-DOS 5.0 and Windows 3.1? Well we at CM have been testing this application for a few weeks now and we have found it to be excellent! The UI may be minimal but don't think for one minute that this product has cut back where it matters, its ability to detect and protect your system from malware attacks is top class. Check it out here: http://www.microsoft.com/security_essentials/
So tell you family and friends! Good, simple, solid AV protection is, at last, available for free!

Friday 5 June 2009

SharePoint and Tagging Content

Plenty has been written in the Blogosphere about Web 2.0 and more recently the idea of Enterprise 2.0 in which the kind of functionality that we're now used to on Wikipedia, Facebook, Twitter, Delicious and so on are used within an organisation's intranet and extranet to improve collaboration. You'll also see Enterprise 2.0 called enterprise social software. It's not a surprise; most people reading this will be users of many of these services and know how helpful they can be for keeping in touch, finding obscure information, and meeting new "friends". It's really easy to see how such technologies would be useful on an intranet, particularly in a large, global organisation where employees can feel lost or isolated. When users know about blogs, wikis and social networking, they'll be comfortable with similar tools for sharing knowledge with their colleagues should they should start using them rapidly.

SharePoint, particularly MOSS, is an ideal platform for Enterprise 2.0 and supports many of the features required straight out of the box. Take a look, for example at the list of features in the Wikipedia article on Enterprise 2.0 (a list which was taken from Andrew McAfee):

  • Search: allowing users to search for other users or content.

    SharePoint has market-leading search functionality for locating content and MOSS includes people search for locating users.

  • Links: grouping similar users or content together.

    In My Site you can identify colleagues and those who have things in common with you. Content can be grouped in lots of ways.

  • Authoring: including blogs and wikis.

    SharePoint includes site templates for blogs and wikis. They're very rapid to set up. There's very rich functionality for collaborative authoring of documents.

  • Extensions: recommendations of users; or content based on profile

    MOSS has lots of ways to do this in My Site.

  • Signals: allowing people to subscribe to users or content with RSS feeds

    Any SharePoint list or document library can have an RSS feed.

  • Tags: allowing users to tag content

    Bad news: SharePoint is a little lacking here and it's this that I want to discuss in this article.

Take the default SharePoint blog template as an example: When you add or edit a post, there's no field for tags. You can place the post in a category, but that's not the same thing because the categories are pre-determined and you can't create a new one on-the-fly. Also you can only put the blog entry in a single category, but you often want to tag it with several different words.

In Web 2.0 there are two kinds of tags. The ones added to content by the author are stored with the content. For example, I've tagged this entry with the word "SharePoint" so that when you click on SharePoint in the word cloud, it will appear. Then there are tags that readers add to the content. Since they only get read access to the site, readers can't store their tags with the content. Instead they save a list of links on a site like Delicious and add tags to those links. I'll deal with these two types of tagging separately.

Author Tags

Of course it's straight forward to add a new column to SharePoint for tags. It's just a text field after all. In the blog homepage click Manage Posts, then under Settings, click Add Column. When you edit a blog entry you'll be able to edit this new field. In most blogging tools, this would be a comma separated list.

Display is a little harder. It would be relatively simple to write a Web Part that displays the tags for an item. This would work when a single blog post is displayed (The view where comments are visible) but you wouldn't see it in the list of all posts. To display tags here, under each post, you'd have to write your own Web Part to replace the Posts Web Part, and include a list of tags for each post. This isn't advanced programming but it would take a little time to get right.

Perhaps more importantly there is no tag cloud display in SharePoint out of the box. I know you've seen a tag cloud before because there's one just to the left of this text. It shows a list of all the tags used in the blog and each is sized according to how often it has been used (SQL Server is the most popular tag as I write). Again, it isn't hard to create a Web Part that does this: you'd need to loop through all the entries in your blog, evaluating and counting the comma-separated terms in your Tags column. Then you output text and probably render style attributes to size each term.

I'm not showing you example code for all this because plenty of people have already written some. Notably the people at wsssearch.com whose tagging controls are part of the Community Kit for SharePoint. Here's their Tag Cloud control running in the standard SharePoint blog site:


Two things to point out about these controls: firstly, they don't just work with blog posts. You could use them with announcements, contacts, or just about any content type including your own custom content types. Secondly, they're open source, which means you can use them as a starting point for more ambitious functionality. For example, you can have a tag cloud that linked to content from across a site collection or even across your whole enterprise. You'd have to be careful about indexing and so on to achieve good performance but with care this could be a really useful control to show users hot topics in your organisation.

User Tags

Delicious-style, user tags are in some ways more interesting than author tags because they work in your community of readers and this is really what Web 2.0 and Enterprise 2.0 are all about. It allows you to find people with similar interests to your own and find links that they like: these will probably help you.

SharePoint is already excellent at finding people, particularly when My Sites are widely used. You can find people with similar skills or who have worked on similar projects or have other things in common with you. You can search by name, department, skill, or any other managed property. So what we need is a simple way for users to save their favourite links and tag each one. These can be displayed on the user profile.

Each user will need a new list in their My Site page, with columns for the URL, the tags (probably in a comma-separated list as before), and then maybe Name and Description. Delicious has Title and Notes fields. There's a good blog entry on deploying list templates to My Sites here if you need help with this.

So far, so simple. Now users can find people like them and see their favourite links and tags. We must make this system effortless to use because it will only be helpful when lots of users add all their favourite links and continue to add them as they find new ones. Users' links are stored in their browser favourites or bookmarks so it's essential to give them a tool for importing these into their My Site profile. How would this work?

On Delicious you export a list of favourites from the browser using its standard tools. You then upload this to the server and tag the imported links. If a link is in a folder, for example one called "SharePoint", that name is added as a tag. But you should then review all the imported links and add tags as you need. This kind of solution would be easy to implement in SharePoint in a Web Part. You would add the ASP.NET FileUpload control to the Web Part. When the user clicks "Upload" you can get this file from the FileUpload.PostedFile property and parse it for all the links and folder names. For each link you'd add a new entry to the user's list in their My Site.

If you build such a solution, you should give careful attention to usability. For example, having uploaded a hundred favourites, a user won't like editing each one individually. You should give them a form with arrow controls that enable them to move to the next and previous entry with a single click. You should give them a list of the other tags they've used before: a single click on the tag adds it to the list. You should use Silverlight or AJAX to maximise the responsiveness of the form and cut down on page reloads.

Finally, consider how to make these tags available and interesting to users. Again a tag cloud control will be really helpful, but this one would have to evaluate many more tags spread throughout a large number of My Sites (each of which is a separate Site Collection). Think carefully about performance and indexing to ensure this cloud runs fast. Again, I'd use the Community Kit for SharePoint code as a starting point. I'd also suggest a hierarchical control to enable browsing tags by user, without having to open multiple My Sites, and other displays such as "Lastest 20 tags", "Most popular 20 tags" and so on. Placing these controls on key intranet pages should help users communicate and generate a buzz around hot topics.

Conclusion

So SharePoint 2007 does indeed do full Enterprise 2.0 functionality with a little bit of custom coding. I think we can safely expect SharePoint 2010 to improve on this. It's almost certain to have a Tag Cloud control built-in for example. But it may be a year or more before your organisation upgrades and as I've shown here, we can make big strides right now without a massive effort. Also, you should be considering the Enterprise 2.0 concepts because they enable users themselves to make their intranet a compelling place to surf. This will be a big topic in SharePoint 2010.

Links

Wikipedia Enterprise 2.0 Article

Delicious

Community Kit for SharePoint

Wednesday 3 June 2009

SQL Server 2008 R2 CTP Announced

The second half of 2009 is shaping up to be an important time for Microsoft as several major product releases are scheduled (including Windows 7, Windows Server 2008 R2, and Exchange Server 2010), along with technical previews for SQL Server 2008 R2 and Office 2010, both of which are due for release in the first half of 2010.

‘Kilimanjaro’ confirmed as SQL Server 2008 R2

The summer 2009 release of the CTP of SQL Server 2008 R2 (previously known as ‘Kilimanjaro’) was announced in May at the Tech-Ed event in Los Angeles, and its emergence, hot on the heels of SQL Server 2008, shows just how committed Microsoft are to taking the lead in the data management arena. Detailed discussion about the new release will have to wait until I can get my hands on the CTP itself, but the range of new features, a full list of which can be found at the SQL Server 2008 R2 site (see end of article), looks very promising. The main points are:

Improved Performance and Management

The new version will support 256 logical processors, up from 64 in the current release. This increase enables you to take advantage of the ongoing advances in multi-core processor technology to provide improved performance, which will be invaluable if you are planning to consolidate databases and servers to cut costs and ease the administrative burden. Improvements to SQL Server Management Studio (SSMS) make the centralized management of multiple servers more straightforward through the provision of enrolment wizards and dashboard viewpoints that give you improved insight and access to key information, such as utilization and policy violations.

Improved Data Quality

With the ever increasing amount of data that organizations have to manage, and the proliferation of locations where that data is stored, maintaining data quality has emerged as a major headache for companies over the last few years. SQL Server 2008 R2 includes ‘Master Data Services’, a new feature that helps organizations to track their data more effectively. Master Data Services comprises a ‘Master Data Hub’ and a ‘Stewardship Portal’ through which you can manage master data. By using Master Data Management to identify and maintain a ‘single version of the truth’ within their data, organizations will benefit from improvements in the reliability of business decisions and other operational processes that are based upon that data.

Self-Service Analysis

Add-ins for Microsoft Office Excel 2010 and Microsoft Office SharePoint 2010 promise to make it easier for users to explore and integrate data from multiple sources and to publish reports and analyses for consumption by other users. In addition, the SharePoint 2010 Management Console enables centralized management of user-generated Business Intelligence (BI) activities, including monitoring, setting policies, and securing resources such as reports. Microsoft refer to this as ‘Self Service Analysis’, the idea being that it places the information that users need into their hands, and so speeds up data-dependent business processes.

Reporting Services

Reporting Services has also been re-vamped with improved drag and drop report creation and enhanced data modelling, which make it easier for non-technical users to create reports, and support for geospatial visualization so that, for example, you can view sales statistics by region in a map format.

Summary

The focus on improved data management and BI in this release of SQL Server comes as no surprise and continues the trend first seen in SQL Server 2005. The R2 version of SQL Server 2008 looks like it will have a lot to offer; the improved processor support alone is a major benefit given the current trend towards server consolidation. As more information becomes available, I’ll let you know, but for now you can register for the CTP download at http://www.microsoft.com/sqlserver/2008/en/us/r2.aspx

Tuesday 2 June 2009

Using Microsoft Bing Maps in SharePoint

The last time I blogged I wrote about SharePoint and Google Maps – specifically how to display maps in a SharePoint Web Part. Since you frequently have geographical information stored in SharePoint, most often as postal addresses, this is a really powerful addition to your developer arsenal. But Google Maps is only one of the mapping providers you can use in this way, for example, there's MapQuest and Yahoo! Maps.

Microsoft's mapping solution is called Bing Maps. Just last week Microsoft announced it is rebranding Virtual Earth as Bing Maps. The API that you use to place Bing Maps on your Web site is now called Bing Maps for Enterprise. For those of you who've developed Virtual Earth code before, you'll be pleased to know there's not much change. A few people asked me how to use this technology in SharePoint – it can be done in a very similar way to Google Maps and in this post I'll cover the differences.

Review of Architecture

As for the Google Maps solution I described in my last post, the interesting part about this task is getting a largely server-side technology like SharePoint to work with a client-side technology like Bing Maps. Suppose you have some search results, each of which has a latitude and longitude, that you want to display in a list and on a map. In a conventional Web Part you'd loop through the results in server-side ASP.NET code to build an HTML list to display on the browser. Bing Maps uses JavaScript on the client to add pushpins like this:

var shape = new VEShape(VEShapeType.Pushpin, map.GetCenter());

shape.SetTitle('A new pushpin');

shape.SetDescription('This is just to demonstrate pushpins');

map.AddShape(shape);

So the question is, how to get client-side code to loop through a collection that only exists on the server?

Our approach is to render an XML island that contains relevant information for each search result. The client side code can locate this island and loop through it, adding a pushpin or another shape for each entry. We'll put the JavaScript in a separate file but embed it as a resource in the .NET assembly as we did for Google Maps.

You could also consider an AJAX-style approach to this problem: this would consist of a Web service that receives search terms and returns results. Client-side code could both render the list and the pushpins on the map and you get all the improvements in responsiveness that are achievable with good AJAX coding. One thing to watch out for: the built-in SharePoint Web Services are not enabled for AJAX so you'd have to write your own.

Most of the coding for this Bing Maps solution is exactly the same as for Google Maps, so you should read this after digesting the previous post. The following tasks are exactly the same:

  • Rendering the XML Data Island.
  • Registering and embedding the scripts in the Web Part assembly.
  • Parsing the XML Island.

That leaves us with three tasks that are different for Bing Maps. I'll describe these below.

Map Results Web Part

To put a Bing Map on a static Web page you must first link to the scripts library:

<script src="http://ecn.dev.virtualearth.net/mapcontrol/mapcontrol.ashx?v=6.2" type="text/javascript" ></script>

Then you must use a <div> tag to position and size the map:

<div id='myMap' style="position:relative; width:800px; height:600px;"></div>

These can both be rendered in server-side code like the following in your map Web Part's Render method:

protected override void Render(System.Web.UI.HtmlTextWriter writer)
{
      //Render the script tags that link to Google Maps API
      writer.WriteLine("<script " +
           "src=\"http://ecn.dev.virtualearth.net/mapcontrol/" +
            "mapcontrol.ashx?v=6.2\" " +
            "type=\"text/javascript\"> </script>");
      //Render the div that will display the map
      writer.Write("<br /><div id=\"map\" " +
            "style=\"position:relative; width: 800px; height: 600px\" ></div>");
}

Loading the Map

This JavaScript function loads and sets properties for the map. This should go in the JavaScript file you have embedded in the Web Part assembly:

var map;

function loadMap(){
      //Create the map
      map = new VEMap("map");
      //The default latitude and longitude.
      var latlong = new VELatLong(54.59088, -4.24072);
      //The default zoom level
      var zoomlevel = 5;
      map.setCenterAndZoom(latlong, zoomLevel);
      //Add the controls
      map.SetDashBoardSize(VEDashboardSize.Normal);
      map.LoadMap();
      //Parse the XML in the HTML data
      parseXmlIsland();
}

The parseXmlIsland function is just like that for Google Maps because the XML is the same. For each result in the XML island, it adds a pushpin.

Adding Pushpins

This addPushPin function inserts a new pin at the longitude and latitude specified. The parseXmlIsland function calls this for each result:

function addPushPin(Title, Path, Latitude, Longitude){
     
      //Formulate the HTML that goes into the caption window
      var infoHtml = "<a href="http://www.blogger.com/">" + Title + "</a>";
      //Add the pushpin
      var pinLatLong = new VELatLong(Latitude, Longitude);
      var pin = new VEShape(VEShapeType.PushPin, pinLatLong);
      pin.SetTitle("<h2>" + Title + "</h2>"
      //Add an info window
      pin.SetDescription(infoHtml);
      //Add pushpin to the map
      map.AddShape(pin);
}

Conclusion

So you can Bing Maps in SharePoint using just the same approach as Google Maps. The coding details have differences but the overall architecture and some of the tasks are identical. All the code in both my posts uses latitude and longitude, but both APIs provide geo-coding functions that can convert an address into polar co-ordinates if you need it.

Links

Windows SharePoint Services Developer Center

SharePoint Server Developer Center

Bing Maps Interactive SDK

Fast Track Data Warehouse Reference Architectures

Introduction
In my previous entries, I’ve covered some of the important new features of SQL Server 2008, how they work and why they help improve efficiency and performance, as well as saving money. In this entry, I’m going to take a slight diversion and introduce you to the recently published Fast Track Data Warehouse Reference Architectures, which are essentially a set of guidelines that will help you to plan and implement data warehousing solutions.
Building a data warehouse represents a major investment for any organization, and it requires a significant development effort. Hardware and software can be complex to install, configure, test, and tune, and because the design requirements of a data warehouse are very different to those for OLTP databases, specialist skills are needed, which your average DBS is unlikely to possess – that’s not to say that DBS’s are not capable of learning these skills, of course, but training them up will add to the project’s cost and potentially delay its progress. As a result of these factors, development can be a very long, expensive process, and because of the complexities involved, there is no guarantee that the finished data warehouse will deliver the desired levels of performance or the business insight that is required to drive revenue.

Fast Track Data Warehouse Reference Architectures
The new Fast Track Data Warehouse Reference Architectures are designed to address these issues and to ensure that organizations can quickly and efficiently create high-performance, highly-scalable, cost-effective solutions that meet the needs of the business effectively.
Specifically, the aims of the Fast Track Reference Architectures are:
• To speed up deployment and provide a faster time to value.
• To lower TCO for the customer
• To provide scalability up to tens of terabytes
• To provide excellent performance out of the box
• To provide a choice of hardware vendors

The Fast Track reference architectures deliver on these aims through a combination of factors:
• Firstly, they provide a set of pre-tested hardware configurations based on servers from trusted leading vendors, including HP, Dell, and Bull. This drastically reduces the time to value and TCO because it removes the need for customers to source, configure, and test hardware and software themselves and it provides a reliable, high-performance platform. The hardware configurations include two, four, and eight processor options so that differing performance, scalability, and pricing needs can be met, and extensive supporting technical documentation and best practice guides ensure that customers can fine tune systems to their specific requirements. The available documentation and support files also make it much more straightforward and less risky for organizations to create their own custom configurations, should they choose to go down that route. The choice of vendors provides the flexibility for organizations to make best use of their existing in-house skill base, and reduces the need for re-training.
• Secondly, they leverage the features of SQL Server 2008 Enterprise Edition to help to deliver performance, flexibility, and scalability, and to drive down TCO. These include data and backup compression, partitioning, Resource Governor, and star join
• Finally, the reference architecture configurations are optimized for sequential I/O and use a balanced approach to hardware that avoids performance bottlenecks in the system. Let’s explore these last two concepts in a little more detail.

Sequential I/O
The Fast Track reference architectures are based on the concept of sequential I/O as the primary method of data access. Data warehouses have a usage pattern that is very different to OLTP systems. A business intelligence query will usually involve selecting, summarizing, grouping and filtering data from tables that consist of millions and billions of rows, and will return results for a range of data. For example, a query may return a summary of sales for a particular product from date A to date B. Rows in fact tables are often stored ordered by date, so SQL Server can process queries like this by accessing data sequentially from disk, which, assuming minimal data fragmentation, is very efficient. Sequential I/O and predominantly read based activity are key characteristics of data warehouse workloads, in contrast to OLTP workloads, which more commonly involve random I/O and extensive read / write activity as rows are inserted, updated and deleted.

Balanced Approach
The second key concept underlying the Fast Track Reference Architectures involves optimizing throughput by taking a balanced approach to hardware. Rather than looking at factors such CPUs, I/O channels, and the I/O capacity of the storage system in isolation, a balanced approach assesses the collective impact of these components on total throughput. This helps to avoid the accidental creation of bottlenecks in the system, which can occur if the throughput of any one of the components is not balanced against the others. For example, if the storage system does not have enough drives, or the drives are not fast enough, the speed at which data is read from them will not be fast enough to match the capacity of the other hardware components (CPUs and the system bus primarily), and performance will suffer. This can be confusing to administrators because monitoring may reveal that, for example, your CPUs have spare capacity, and yet response times are still poor. Adding more CPUs would have no effect in this scenario, because the problem is that the hardware is not balanced correctly. Solving the problem involves improving the throughput of the limiting factor, which in this case is the storage system. A balanced approach starts with the CPUs, evaluating the amount of data that each core can process as it is fed in, and the other components are balanced against this.

Project Madison – Scaling to Petabyte Levels
The Fast Track reference architectures we’ve discussed here are all based on a symmetric multiprocessing (or SMP) ‘shared everything’ model, in which your database is hosted on a single powerful server with dedicated CPU and disk resources. These configurations offer excellent value, scalability, and performance for databases in the 4 – 32 terabyte range, but they are unsuitable for larger implementations because the resultant increased resource contention erodes the performance benefits. An extended set of reference architectures, codenamed ‘Project Madison’, are due for release in the near future. Madison provides a scale-out, shared nothing architecture based upon the concept ‘massive parallel processing’ (or MPP), in which multiple servers work together, coordinated by an MPP query optimizer . ‘Shared nothing’ refers to the fact that each server has its own set of resources, which it does not share with any of the other servers. Madison enables growth from terabyte levels to petabyte levels through scaling out, providing a growth path for businesses that meets their requirements now and in the future.

Monday 1 June 2009

LiveID, authentication and the cloud

I would imagine that by now, most people who use Windows (and other operating systems), would have signed up for a LiveID. This is the mechanism that Microsoft use just about everywhere they need to authenticate users on the web. You may have noticed that LiveID accounts can be used on non-Microsoft sites as well.

In this post I wanted to summarize some of the scenarios for using LiveID, and illustrate its usefulness as an authentication mechanism.

  • From a user’s perspective, having to remember a single id and password for a whole lot of sites is convenient. Sometimes a user even **appears** not to have to log in at all, because their credentials are remembered for them.
  • From a developer’s, having someone else look after the authentication process can dramatically simplify an application.

The scenarios I’d like to outline are:

  1. Logging in directly to a LiveID enabled application. Examples include Windows Live Messenger, or Live Mesh.
  2. Using delegated authentication. Your application needs to use a resource in another LiveID enabled application.
  3. Using persistent delegated authentication. Your application needs to use a resource in another LiveID enabled application, but you don’t want to keep asking the user for their credentials.
  4. Using LiveID as the authentication mechanism for your application.
  5. Using a LiveID to authenticate against an OpenID enabled application.

I’m sure there are plenty of other scenarios, but these 5 strike me as the most interesting and useful in practice.

Scenario 1 - Logging in directly to a LiveID enabled application

The most trivial version of this (from a user’s point of view) is logging in to an application like Windows Live Messenger or a protected page somewhere on microsoft.com. Once the user has registered for a LiveID, they can log in anywhere they see the LiveID login logo.

A slightly more complex version of this scenario (for a developer) would be logging in from within a web application.

var accessOptions = new LiveItemAccessOptions(true);
NetworkCredential credentials = new NetworkCredential(userName, password);
LiveOperatingEnvironment endpoint = new LiveOperatingEnvironment();
var authToken = credentials.GetWindowsLiveAuthenticationToken();
endpoint.Connect(authToken, AuthenticationTokenType.UserToken, meshCloudUri, accessOptions);
Mesh meshSession = endpoint.Mesh;
HttpContext.Current.Session["MeshSession"] = meshSession;

The code above logs a user on to the Live Mesh Operating Environment, using the id and password provided by the user. Presumably here, the endpoint looks after the authentication process for you. After that the web application is caching the authenticated Mesh object for the duration of the user’s session.

The significant feature of this scenario, is that all the interaction with LiveID is handled by someone else – in this case the Mesh Live Operating Environment.

Scenario 2 - Using delegated authentication

This scenario differs from the first in that your application needs to authenticate with LiveID **before** accessing a resource. For example, you might have a web application that enables a user to send and receive instant messages from within the application. In this case your application will have to log in to Windows Live Messenger on behalf of the user, hence delegation. You also want the user to have to provide their credentials once per session, so they don’t keep getting prompted to sign in!

Assuming the user already has a LiveID, this scenario breaks down into two major steps:

  1. The user must give their consent for your application to access their Live Messenger account. Ideally this happens only one, or at least infrequently (once a month?).
  2. The user logs in at the start of their session, and your application can then send and receive instant messages for them during the session.

The consent phase

Here the user is giving consent for this **specific** application to have permissions to access their Live Messenger account for some period of time.

  1. Your application must be able to uniquely identify itself – so you must register your application on the Azure Services Developer Portal and get some identifying codes.
  2. Your application must redirect the user to the LiveID consent webpage (passing your app’s unique identifying codes) to allow the user to give their consent.
  3. Your user will be automatically redirected back to your application after giving consent. Also, LiveId will return a consent token (see below) in a cookie to your application.

All of these interactions are, of course, encrypted.

The user uses your application

This is where the delegation occurs – your application can use Live Messenger on behalf of the user.

  1. Once the user has authenticated using LiveID, the LiveID servers return an encrypted cookie called a consent token (if the user doesn’t already have one from the consent phase). This consent token contains, amongst other items, a delegation token and some expiry details. The consent token is potentially a long-lived token (there is also a renewal/refresh mechanism that I won’t go into here).
  2. From this point on, whenever your application needs to interact with Live Messenger, it will send the signed delegation token back to the server.

Once the user logs off, the two tokens are lost, so when they go back to the site they’ll have to log in again and get a new consent token. To avoid replay attacks, the delegation token is signed and datetime stamped.

Scenario 3 – Using persistent delegated authentication

This scenario is very similar to scenario 2. In scenario 2, each time the user uses your application, they have to sign on again to get access (in this example) to the messenger functionality. If your application can cache the consent token, perhaps in a database, then there is no need for the user to have to log on because the delegation token can be re-signed and sent. The only time the user might have to sign on again is to refresh the consent token when it expires.

This approach leads to a much better user experience, but you do have to have a secure way of storing the consent tokens.

Scenario 4 - Using LiveID as the authentication mechanism for your application

The first three scenarios are all using a LiveId as way of authenticating against an existing (Microsoft) application or resource. There is nothing to prevent you from using LiveId as your own application’s authentication mechanism. This has a number of advantages:

  1. You don’t have to go through the hassle of designing your own authentication system, and implementing databases to store userids and passwords etc.
  2. The user doesn’t have to remember yet another userid and password.
  3. You have a a tried and tested authentication scheme.

This scenario is again, very similar to scenario 2. You need to register your application on the Azure Services Developer Portal and obtain your unique identifying codes. The Live SDK includes a set of web controls that will simplify the task of building your UI and handling the various tokens and cookies.

Scenario 5 - Using a LiveID to authenticate against an OpenID enabled application

OpenId is an interesting approach to try and provide a framework where a user might need just one online digital identity, instead of the dozens of userids and passwords most of us currently have.

An OpenId provider enables users to create a digital identitiy (ie create a userid and password). The OpenId provider also validates identities on behalf of other sites. So, for example, if I want to use a site like Stackoverflow, I will need an OpenId. When I visit Stackoverflow, it needs to know who I am, so it asks me for an OpenId. I am then redirected to my OpenId provider where I enter my password, and if it’s correct I’m redirected back to Stackoverflow. Stackoverflow knows who I am, without even having to see my password because it trusts the OpenId provider to authenticate me.

Microsoft currently have a beta version of LiveId working as an OpenId provider. So, if you want your digital identity to be your LiveId, that’s now possible. Of course your could select a different OpenId provider if you preferred.

Thursday 28 May 2009

Using Google Maps to Display Geographical Information in SharePoint

Google Maps provides a really simple way to display geographical information, such as a set of pinpoints or a route, in the context of the surrounding geography, and developers can use it for free on Internet-facing sites. If you have data stored in Microsoft SharePoint products or technologies that includes geographical information, you should consider if a map display might help your users. I'm going to show you how to use Google Maps with the SharePoint user interface and demonstrate some simple coding techniques.

Microsoft's flagship SharePoint product is Microsoft Office SharePoint Server 2007 but you could easily use maps in the free Windows SharePoint Services 3.0 or other products based on SharePoint, such as Search Server 2008.

Take a good look at all the mapping solutions before starting to code. You may prefer Virtual Earth's user interface or find that Yahoo! Maps have more detail in a location that is important to you. I've coded Google Maps for a customer, and it is the most popular solution, but if you chose Virtual Earth instead the only difference would be in the JavaScript code I describe.

I'll concentrate on the use of Google Maps to display search results but the methods described can be applied other sources of data such as a SharePoint list, an Excel spreadsheet, or a Business Data Catalog (BDC) connection.

General Architecture

SharePoint is built on the ASP.NET 2.0 server-side development technology and its user interface is built from ASP.NET Web Parts. Web Parts allow administrators and users to customize the user interface to match their needs. They can add or remove Web Parts or rearrange them on the page. In the Web Part Gallery, site administrators can control which Web Parts are available. When you develop user interface components for SharePoint you should create them as Web Parts to inherit this flexibility automatically. You should also consider whether to create more than one Web Part to encapsulate different aspects of functionality that users can easily differentiate.

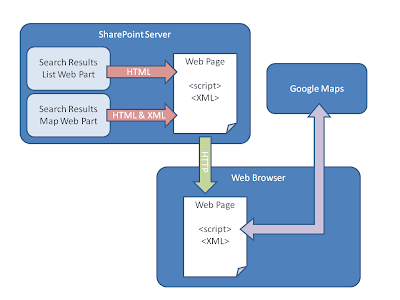
As an example consider a search tool for geographical data. When the user clicks "Search" the tool presents a list of results that match their terms as you might see in an Internet search engine or the SharePoint Search Center. However this tool also presents a Google map with the results pinpointed. This tool might warrant three Web Parts; one for the search terms, one for the results in a list, and a final one for the results on a map. In this architecture users or administrators could show just the list, just the map, or both displays.

Unlike Web Parts, Google Maps are coded in client-side code. JavaScript is used in the browser to create and position the map, add pinpoints, add captions, and draw shapes. This is what makes life interesting. Your Google Maps SharePoint solution must address how to communicate between server-side Web Parts and client-side JavaScript. You could, for example, publish a Web Service on the server and have client-side code query it and present results. AJAX would provide a lot of help with this. In the method I used, a server-side Web Part generates XML and renders it as an island amongst the SharePoint HTML. In the browser, JavaScript can locate this island and use it to draw the map and add pinpoints.


Search Results Web Part

In most search tools, results are presented in a list with links to each, a short description, and sometimes other fields. To build a SharePoint Web Part that displays search results, you submit a query by using a Microsoft.SharePoint.Search.Query.FullTextSqlQuery object. This returns a ResultTable object through which you must loop to evaluate each individual result and display them to users.

XML Data Island

As your code loops through the ResultTable, you can build the XML to place as an island in the Web page that will be returned to the client. To do this, create a System.Xml.XmlWriter object and configure it with a corresponding XmlWriterSettings object:

//Create the XML Writer Settings for configuration

XmlWriterSettings settings = new XmlWriterSettings();

settings.Encoding = System.Text.Encoding.UTF8;

settings.Indent = true;

settings.OmitXmlDeclaration = true;

//This string builder will be used to render the XML

resultsForMap = new StringBuilder();

//Create the XML writer

XmlWriter writer = XmlWriter.Create(resultsForMap, settings);

Then you can write the start element for your XML:

writer.WriteStartElement("MapResults", "my.namespace");

Looping through the DataRow objects in the ResultTable.Rows collection, you can add XML elements with the properties you need. For example:

foreach (DataRow currentResult in myResults.Rows)
{
      writer.WriteStartElement("Result");
      writer.WriteElementString("Title",
            currentResult["Title"].ToString());
      writer.WriteElementString("Path", path);
      writer.WriteElementString("Latitude",
            currentResult["SupplierLatitude"].ToString());
      writer.WriteElementString("Longitude",
            currentResult["SupplierLongitude"].ToString());
      writer.WriteEndElement();
}

You must remember to end the XML and flush the writer:

writer.WriteEndElement();
writer.Flush();

Your XML is now flushed to the StringBuilder object (named resultsForMap in the above example). To render this string on the SharePoint Web page you can use an ASP.NET Label like this:

returnedXmlLabel.Text = "<xml id="\">" +
      resultsForMap.ToString() + "</xml>";

The ID you use for this XML island allows JavaScript code to locate it when the map is rendered on the client.

Map Results Web Part

Since the work of populating the map with points and captions is done in client-side code, there is little to be done in ASP.NET code for the Map Results Web Part. However it is necessary to render a <div> tag for the map, and a <script> tag for the Google Maps code library. This <script> tag is where you must render the Google Key associated with your Google Maps account.

protected override void Render(System.Web.UI.HtmlTextWriter writer)
{
      //Render the script tags that link to Google Maps API
      writer.WriteLine(String.Format("<script " +
            src="\http://maps.google.com/maps?" +
            file="api&v=2&key={0}\ " +
            type=\"text/javascript\"> </script>",
            "Your key here" ()));
      //Render the div that will display the map
      writer.Write("<br /><div id=\"map\" " +
            "style=\"width: 800px; height: 600px\" ></div>");
}

Registering and Embedding the Scripts

In the Map Results Web Part, you must also ensure that the JavaScript, which generates the map and populates it with pinpoints, executes when the page reaches the client. ASP.NET 2.0 provides an elegant way to do this: you can embed script files as resources in the same assembly as the Map Results Web Part. This makes deployment simple, because the script is part of the assembly.

You must complete several steps to embed a script file in your Web Part assembly:

  1. Add a JavaScript file to the Visual Studio project and write the JavaScript Code.

    This file is where you place all the Google Maps code. For examples of such code, see "JavaScript Files" below.

  2. Add Web resource entries to the AssemblyInfo.cs file.

    This file contains information about the assembly such as version numbers. You can add a reference to a script file like this:

    [assembly: WebResource("MyNameSpace.MapScripts.js",
          "text/javascript", PerformSubstitution = true)]

  3. In your Map Results Web Part, register the script resource.

    You should do this in the OnPreRender method:

    protected override void OnPreRender(EventArgs e)
    {
          //Register the JavaScript file
          Page.ClientScript.RegisterClientScriptResource(
               this.GetType(), "MyNameSpace.MapScripts.js");
    }

  4. Make sure the script runs whenever the page loads.

    You do this by registering the script as a startup script. Add the following line to the Map Result Web Part in the Render method:

    this.Page.ClientScript.RegisterStartupScript(
          this.GetType(), "MapScriptsStart", "loadMap();", true);


JavaScript Files

We now have an XML island rendered in the SharePoint Web Part that contains all the results that must appear on the map. We have also embedded a JavaScript file in the Web Part assembly to execute when the page loads on the client. The final task is to write JavaScript in the embedded file that loads the Google Map and add pinpoints and other objects.

Loading the Map

First, create a global variable to reference the map itself. You will need this throughout the script file:

var map;

Next create a function to load the map. This should match the function you specified in the RegisterStartupScript method in the previous section:

function loadMap(){
      //Create the map
      map = new GMap2(document.getElementById("map"));
      //Centre it on default latitude and longitude.
      map.setCenter(new GLatLng(54.59088, -4.24072), 16);
      //Set a default zoom level
      map.setZoom(5);
      //Add the controls
      var mapControl = new GLargeMapControl();
      map.addControl(mapControl);
      map.enableScrollWheelZoom();
      map.addControl(new GMapTypeControl());
      map.setMapType(G_SATELLITE_MAP);
      //Parse the XML in the HTML data
      parseXmlIsland();
}

Parsing the XML Island

The last line of the above code calls a separate parseXmlIsland function. This function locates the XML island and loads it into a variable. This must be done slightly differently depending on the user's browser:

var xmlIsland;
try //Internet Explorer
{
      xmlIsland = new ActiveXObject("Microsoft.XMLDOM");
}
catch (e)
{
      try //Firefox, Mozilla, Opera etc.
      {
            xmlIsland =
            document.implementation.createDocument("", "", null);
      }
}
xmlIsland.async = "false";
xmlIsland.validateOnParse = "false";
xmlIsland.loadXML(document.getElementById("resultsformap").innerHTML);

Setup some variables and get all the results nodes you placed in the XML:

var Title, Path, Latitude, Longitude;
var resultNodes = xmlIsland.getElementsByTagName("Result");

Now, loop through the node, storing relevant information:

var resultNode;
var resultNodeChild;
for (i = 0; i < resultNodes.length; i++) {
      resultnode = resultNodes[i];
      for ( j = 0; j < resultNode.childNodes.length; j++) {
            resultNodeChild = resultNode.childNodes[j];
            switch (resultNodeChild.nodeName) {
            case "Title":
                  Title = resultNodeChild.text;
                  break;
            case "Path":
                  Path = resultNodeChild.text;
                  break;
            case "Latitude":
                  Latitude = parseFloat(resultNodeChild.text);
            case "Longitude":
                  Longitude = parseFloat(resultNodeChild.text);
                  break;
            }
      }
      //Add a point for this result
      addPinPoint(Title, Path, Latitude, Longitude);
}

Adding Pinpoints

The above code calls the addPinPoint function for every result in the XML island. This function adds a pinpoint to the Google map in the standard way:

function addPinPoint(Title, Path, Latitude, Longitude){
      //Set up the icon
      var myIcon = new GIcon(G_DEFAULT_ICON);
      //Select the right icon
      myIcon.image = "mapimages/myPinPointIcon.png";
      myIcon.iconSize = new GSize(12, 30);
      myIcon.shadow = "mapimages/myPinPointShadow.png";
      myIcon.shadowSize = new GSize(23, 30);
      myIcon.iconAnchor = new GPoint(6, 30);
      markerOptions = { icon:myIcon };

      //Formulate the HTML that goes into the caption window
      var infoHtml = "&lta href="http://www.blogger.com/">" + Title + "</a>";

      //Add the marker
      var point = new GLatLng(Latitude, Longitude, false);
      var marker = new GMarker(point, markerOptions);

      //Add an info window
      GEvent.addListener(marker, "click", function () {
            marker.openInfoWindowHtml(infoHtml);
      });

      //Add the overlay
      map.addOverlay(marker);
}

Licensing Considerations

The techniques I've outlined illustrate that Google Maps can be easily integrated into a SharePoint site and become a valuable addition to SharePoint functionality. However, before you develop such a solution, you must investigate licensing restrictions fully. This section describes the main issues and alternative map providers.

Licensing Google Maps

Google Maps is free for use on Internet-facing, non-subscription sites. If you use SharePoint to host your organisation's main Web site, or more targeted sites for departments, subsidiaries, or products, you can use Google Maps for no charge on pages with no access restrictions.

Google Maps does not allow free use on any password-protected page or on intranet sites. In such cases you can still use the technology, but you must take out a Google Maps for Enterprise license. Google Maps for Enterprise is licensed on a per-concurrent-user basis.

Microsoft Virtual Earth and Other Providers

Microsoft's Virtual Earth service competes directly with Google Maps and works in a similar way. There is an approximately equivalent set of features and maps are drawn and populated by using client-side code just like Google Maps. To use Virtual Earth with SharePoint your general approach can be identical to that described above although you must rewrite the JavaScript code to use the Virtual Earth classes and methods. On the intranet, Virtual Earth is licensed on the basis of total users.

Yahoo! also have a mapping service. This can be used free on both Internet and intranet sites so you should consider it carefully for SharePoint enterprise content management or knowledge management solutions restricted to your internal users. Yahoo! Maps cannot be used in applications for which you charge users. There are also other alternatives, such as PushPin.

Summary

Google Maps represents the easiest way to display geographical data on Web sites, including those hosted in Microsoft SharePoint products and technologies. If you carefully plan how to integrate the server-side SharePoint technology with the client-side Google Maps code, you can easily integrate the two and generate a rich user experience for geographical data.

Links

Windows SharePoint Services Developer Center

SharePoint Server Developer Center

Google Maps API Documentation